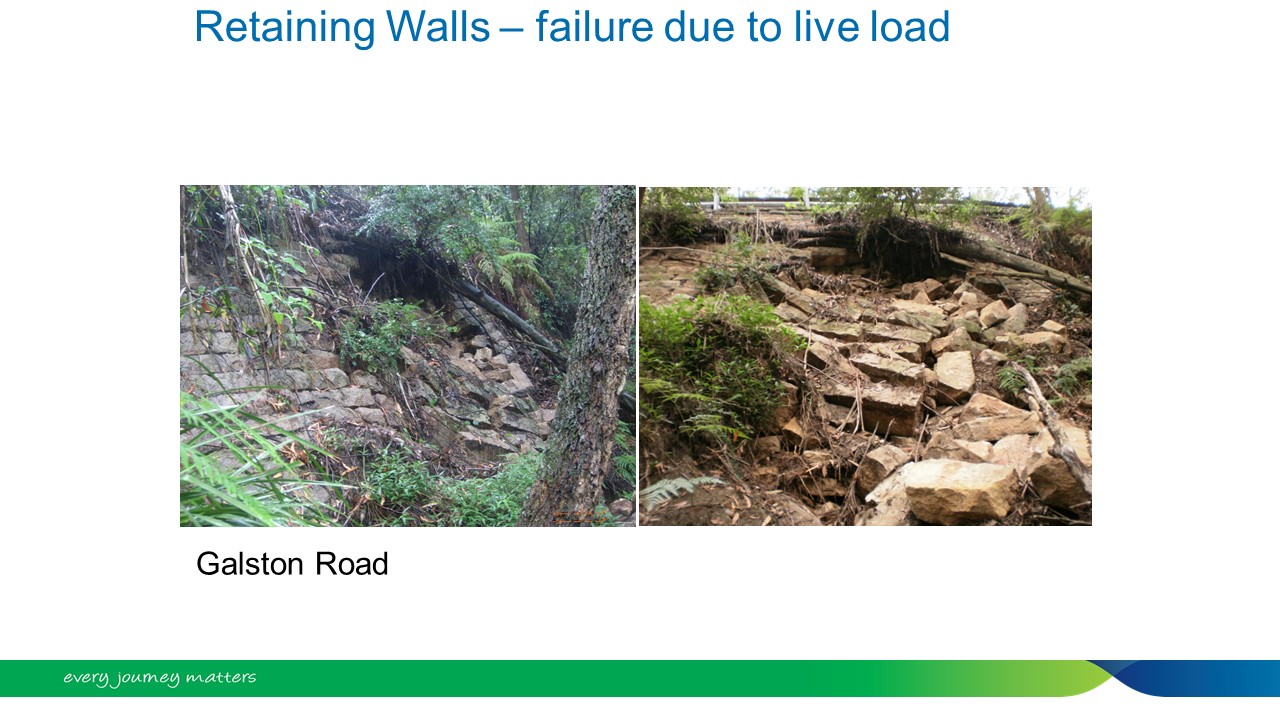
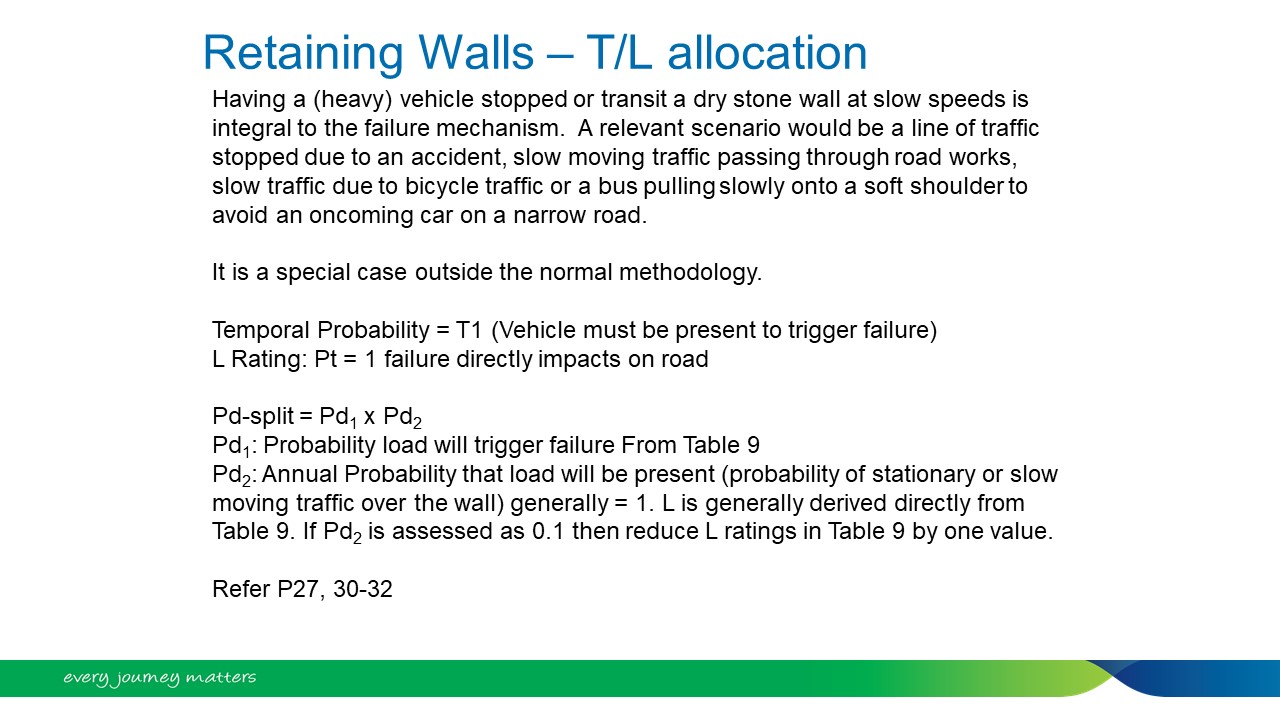


Some questions have been raised concerning analysis of retaining wall failures under a live load. I have added the current slides from the presentation to provide further detail about the correct method. Important to note that the failure can only occur with the live load present (So T=T1).
L rating is a composite derived from Pd1 x Pd2 (see page 27 of the guide) where:
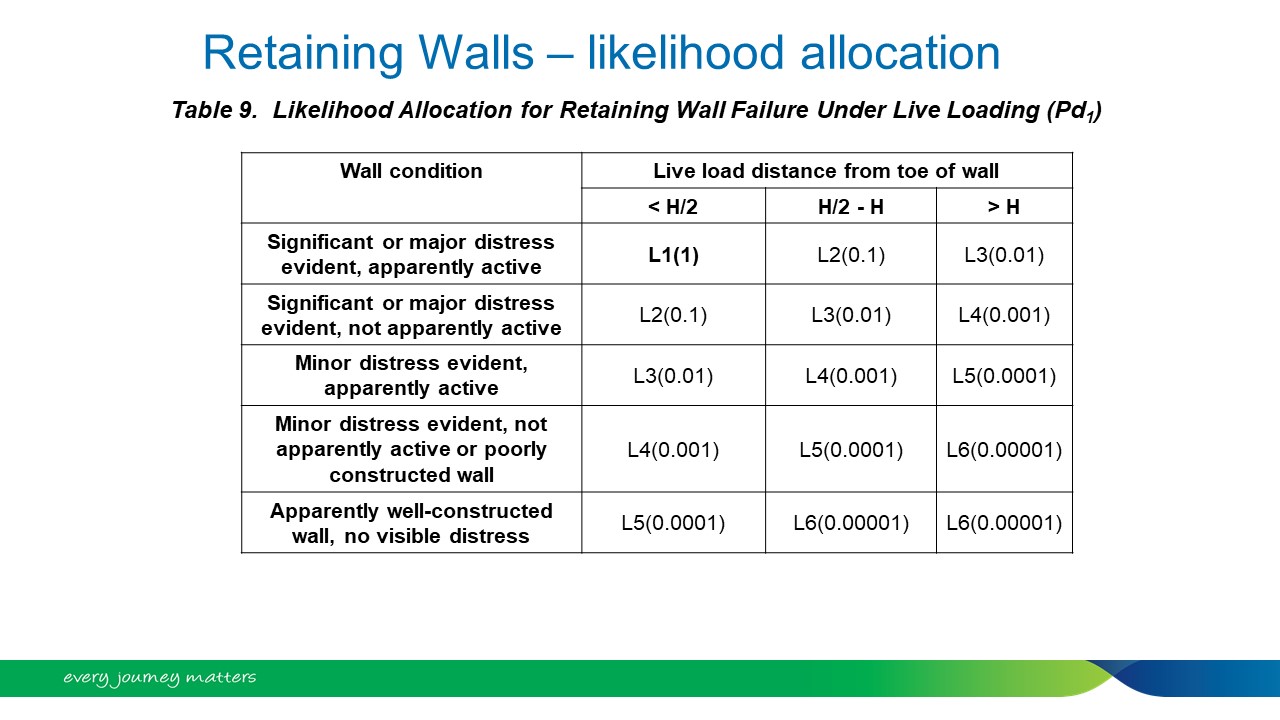
In general P(d2) equals 1 – indicating it is almost certain a loading event will occur annually. In this case the L values in Table 9 may be applied without change and provide P(d1). If Pd2 is assessed as less than 1 (eg 0.1) the L values in table 9 need to be adjusted accordingly (multiply by Pd2).
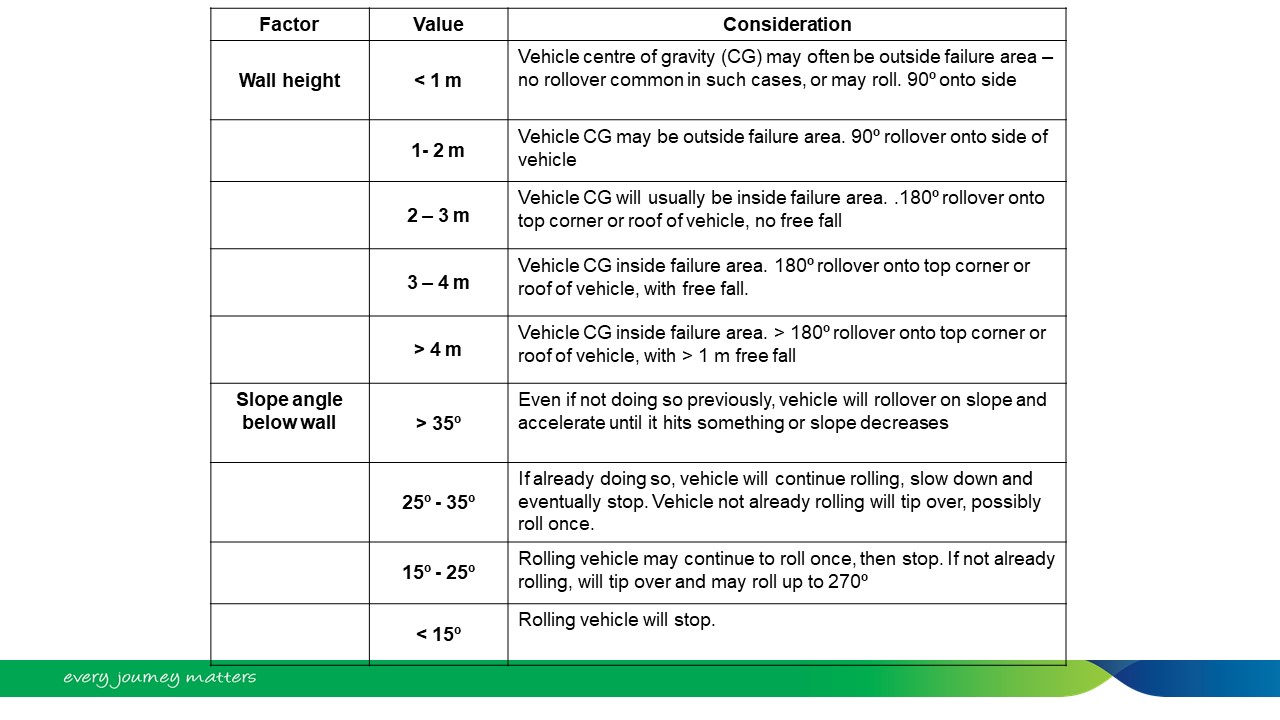
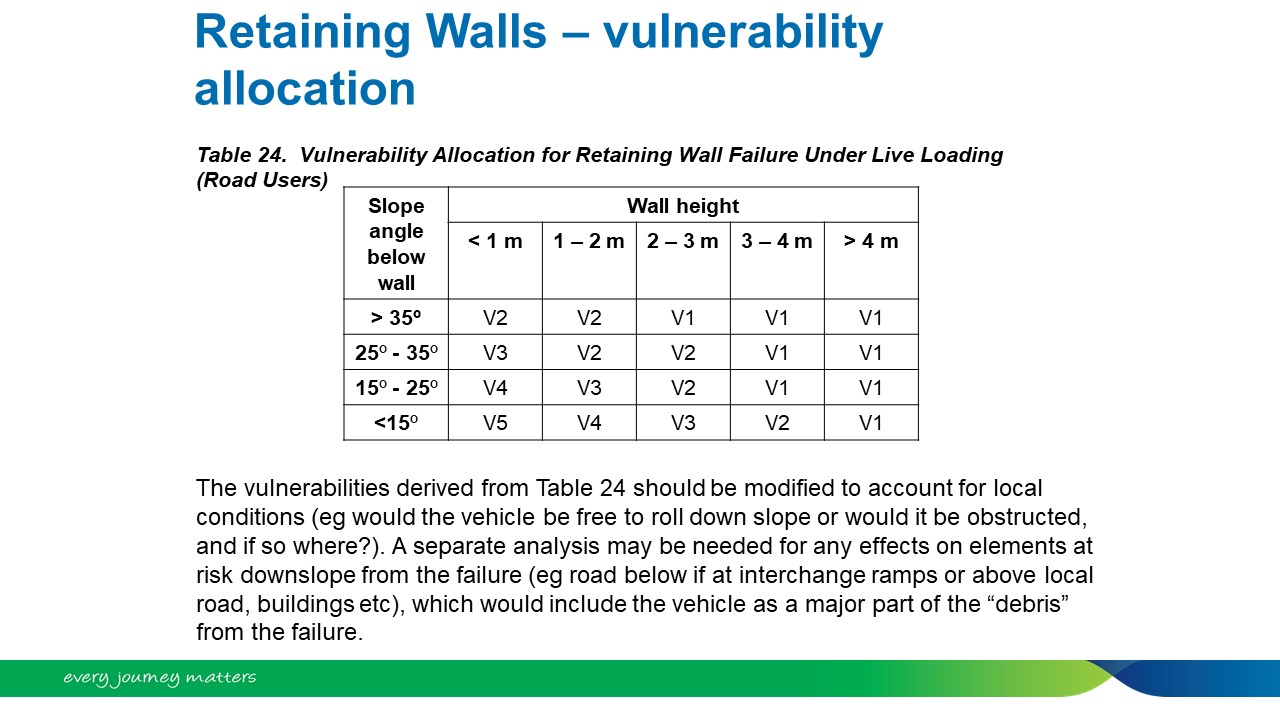
Vulnerability is assigned using wall height and angle of slope below from table 24.
In general walls showing significant or major distress with the live load close to the top of the wall will produce high risk outcomes (depending on wall height and angle of slope below).
Mobile Site | Full Site
Get a free blog at WordPress.com Theme: WordPress Mobile Edition by Alex King.