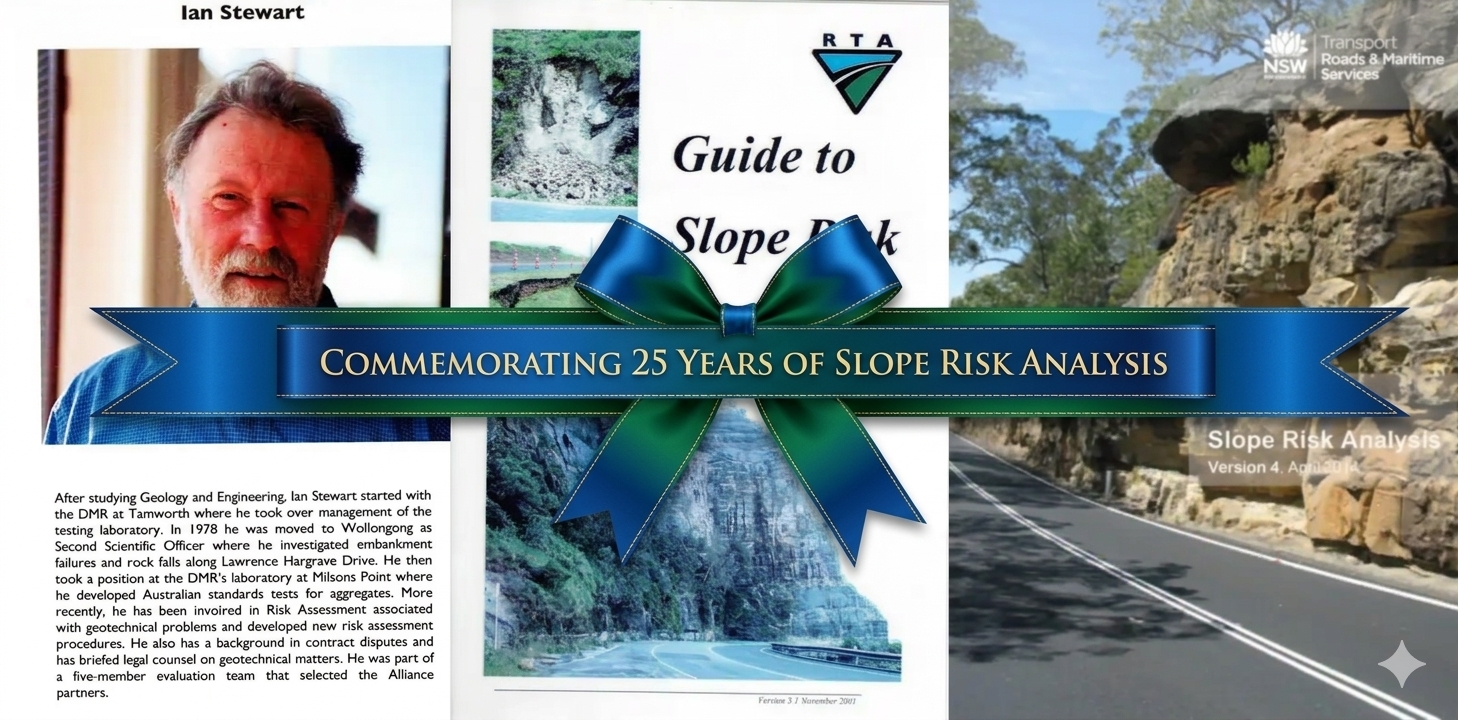
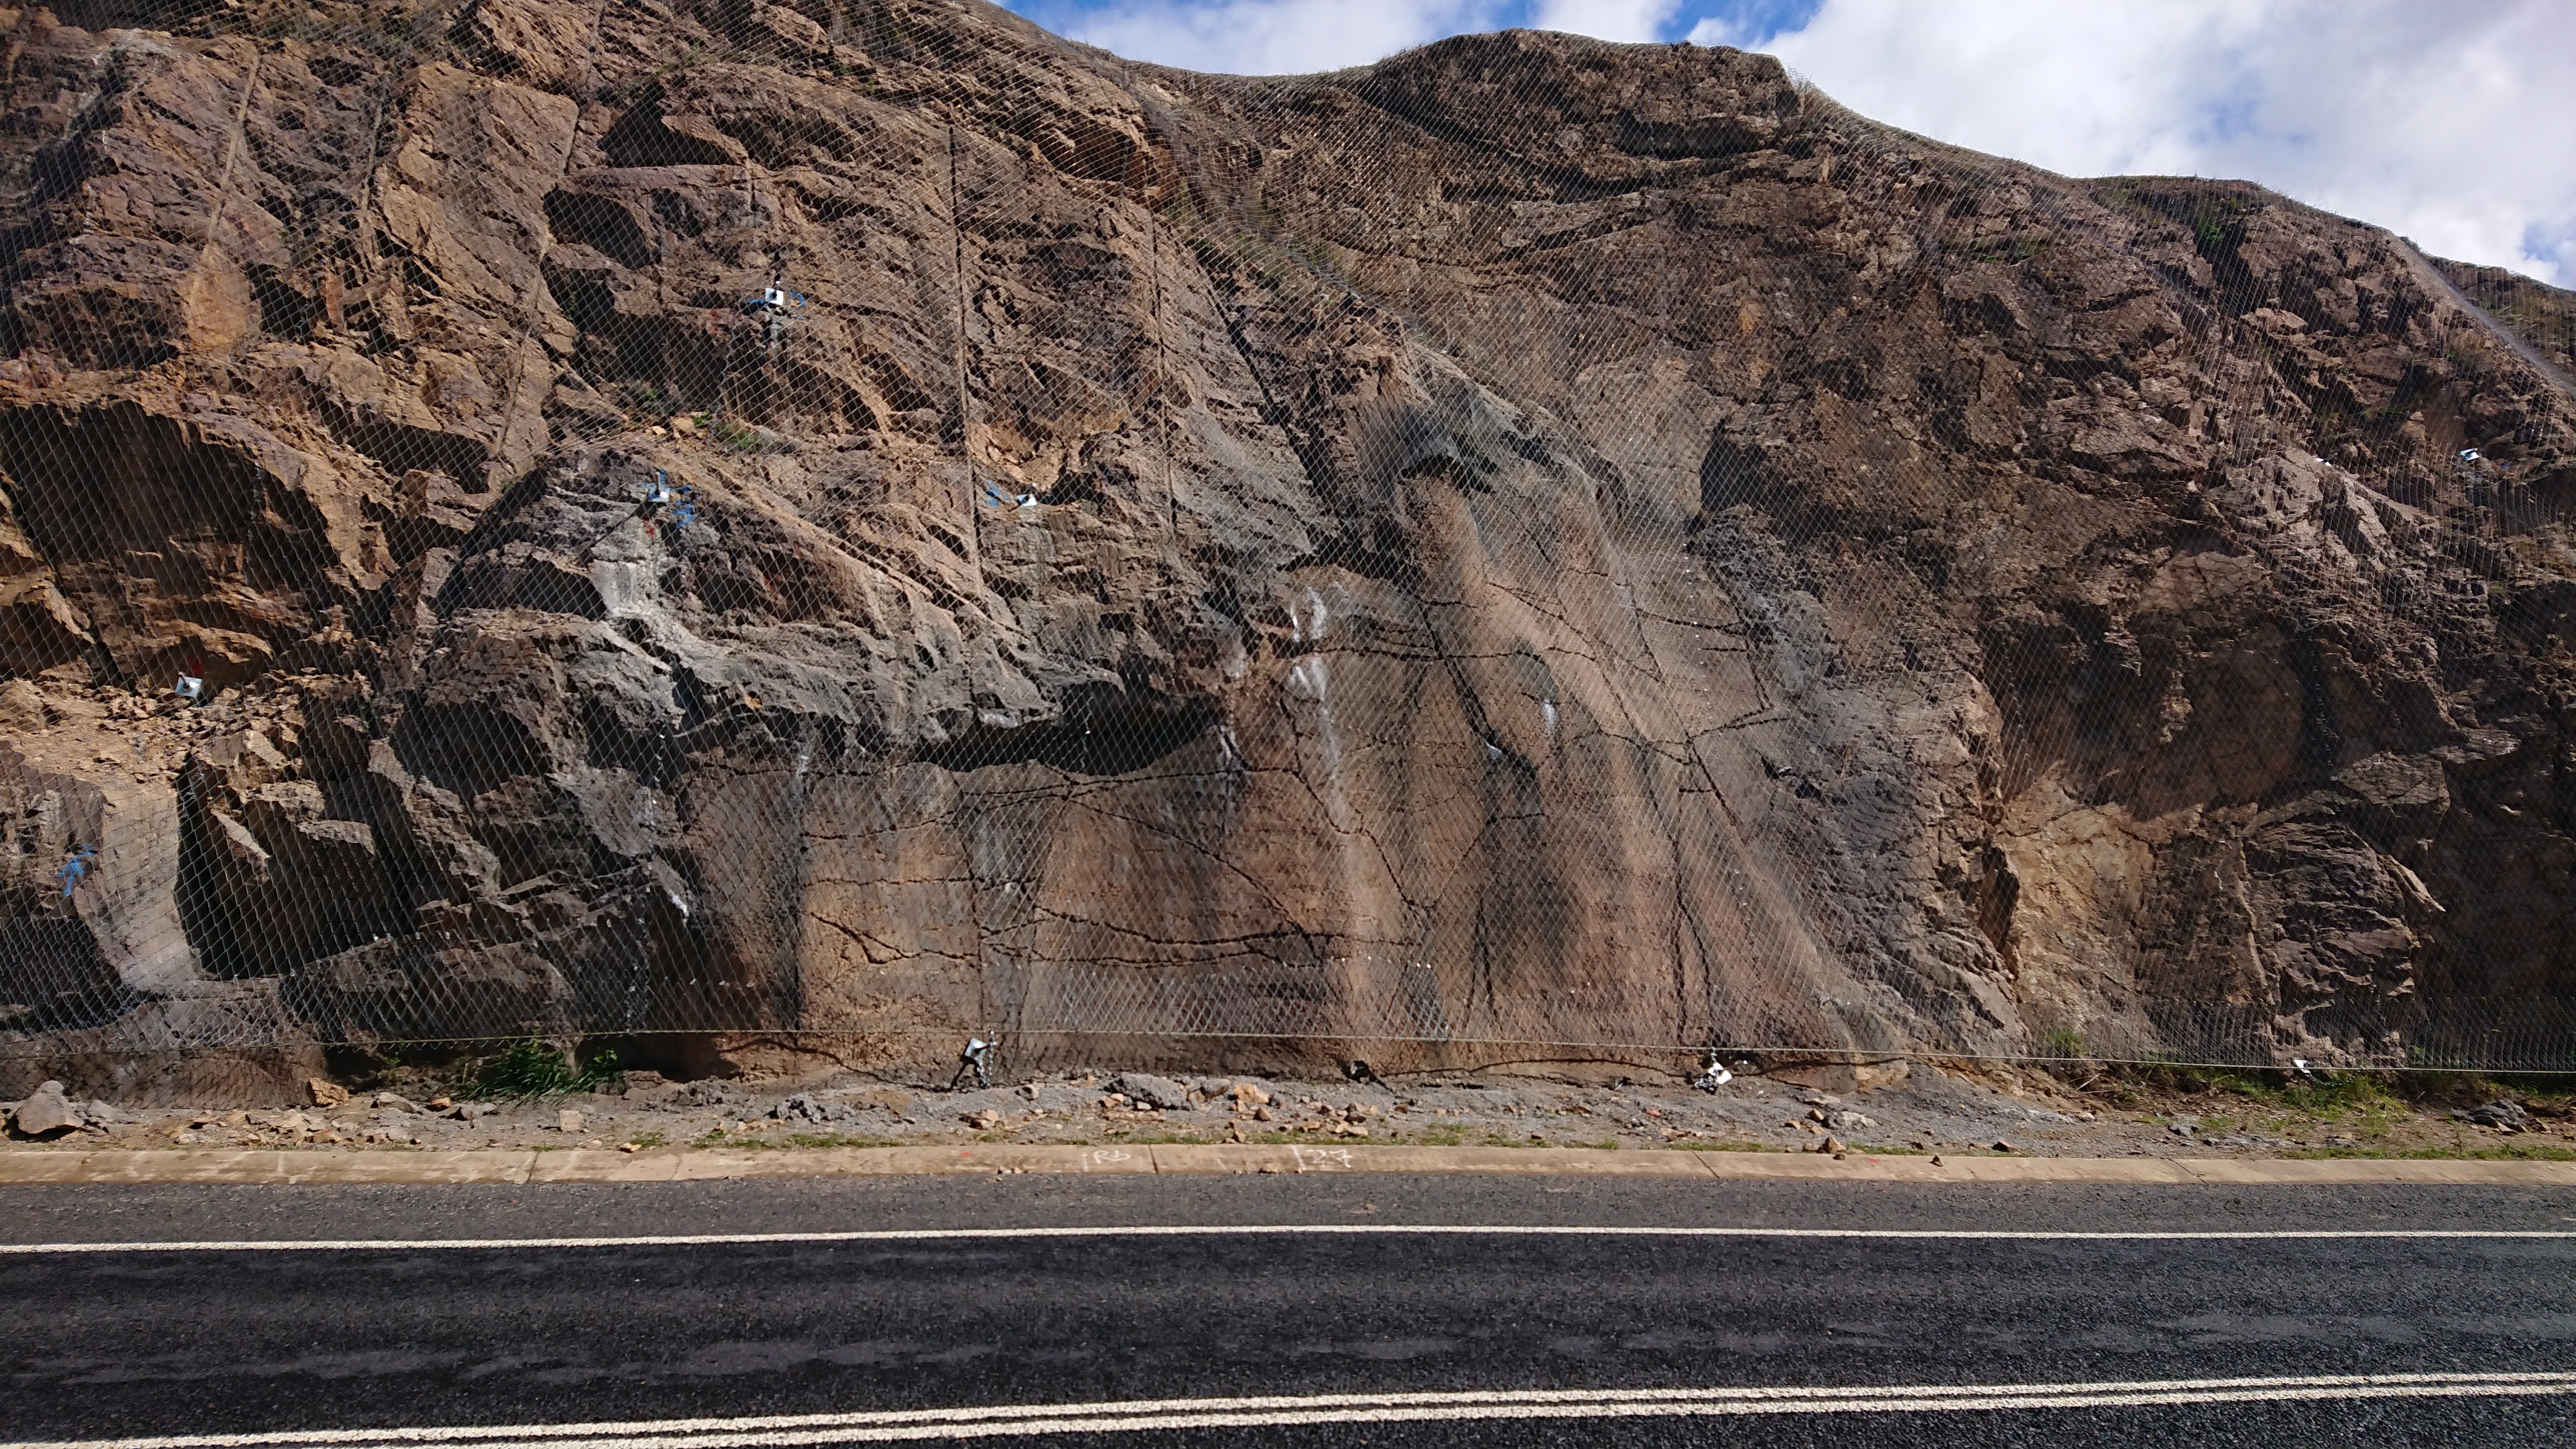
The RTA/RMS/TfNSW Guide to Slope Risk Analysis (The Guide) is largely the work of the late Ian Stewart assisted by a small group of consultants. The first full course in The Guide following publication of Version 3.1 was held in February 2002 for internal RTA geotechnical staff. Training courses for external consultants kicked off in late 2004.
The course (V3.1 and V4) was run mainly in southern NSW (2002-2019) with a few courses run in northern NSW (2002- 2011). Since 2022 NSW courses are based in Lithgow. QLD and NZ have introduced their own training courses based on Ian’s gruelling 5-day schedule. Over 600 geotechncial professionals have participated in the program.
Training provided for the commencement of the wider RTA Slope Risk Analysis program. The program has been highly successful in reducing overall risk from landslides to the NSW road network. There are currently close to 10,000 slopes in the RTA (TfNSW) slopes database. As many slopes have been reassessed, some multiple times, the total number of SRA is in the order of 20,000+. The guide is now used to assess slope risk on road networks in most Australian states and the ACT, and has also been adopted by NZTA. QLD and NZ have introduced their own training courses.
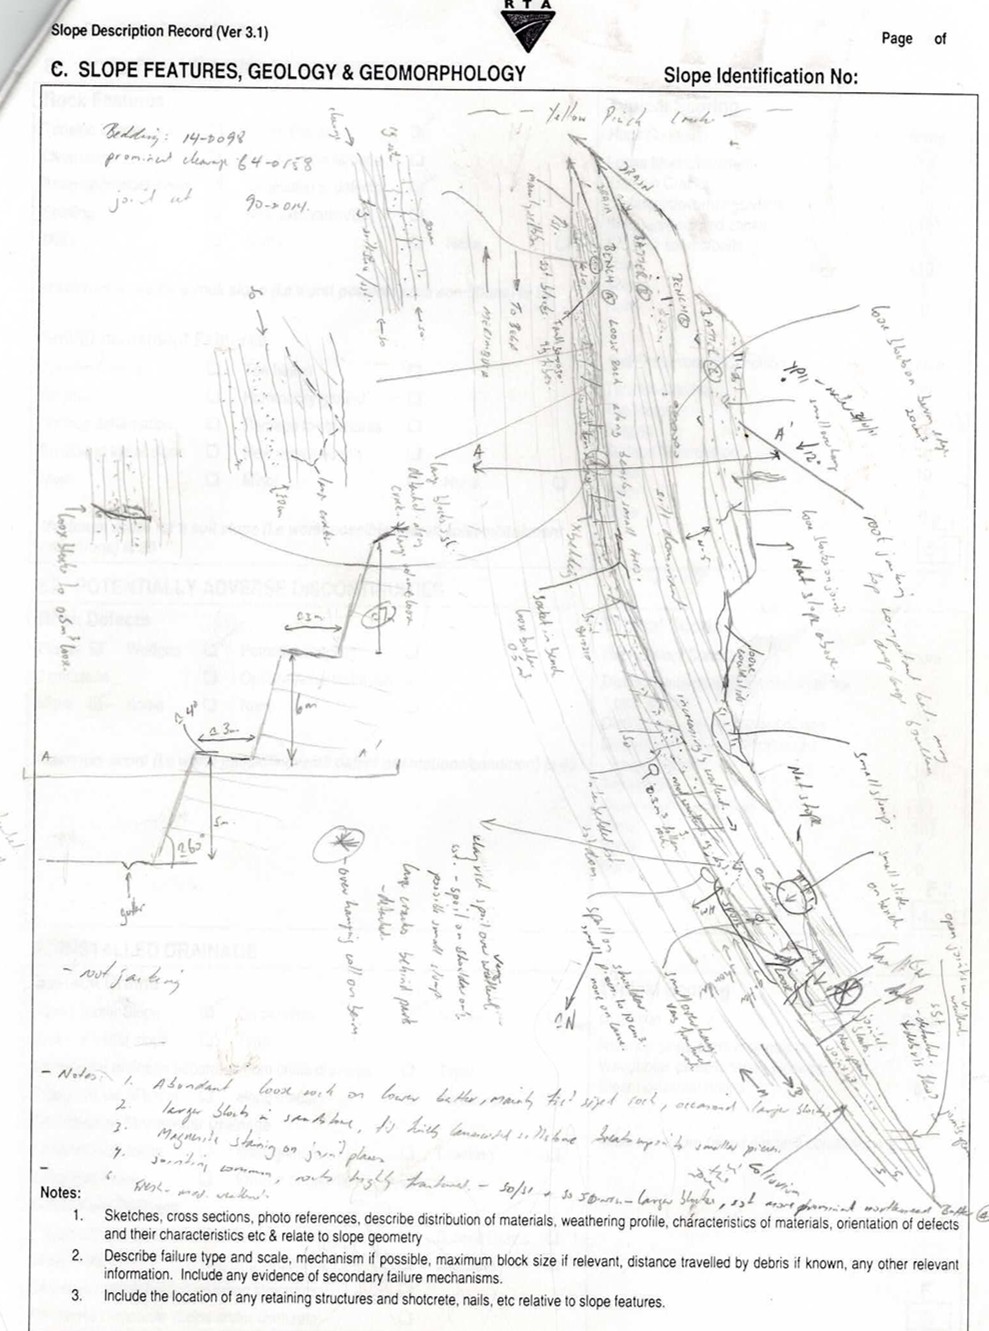
First attempt at V3.1 site sketch Yellow Pinch Cutting – M Hendrickx Feb 2002
To mark this occasion and celebrate Ian’s legacy, I’m working with a small number of professional colleagues on collating a history of the development of The Guide, its application and impact. This is intended for publication to my company website (marchgeo.com) and would also be condensed into a paper to be submitted to the AGS Journal. Timing is planned for early 2027. There may also be a celebratory lunch or dinner!
I’m looking for contributions from others who have completed the training and have applied the method. If you have a short story, recollection, photos or other memorable event related to The Guide, training program or use of the system – good or bad, I would love to hear from you. These would be published to the website, with the best perhaps getting into the proposed journal article. If you would like to make these anonymously, let me know.
This report presents a preliminary model for the evolution of the Langtang/Tsangbu rock avalanche and debris flow event. This intuitive model is intended to stimulate further analysis and discussion of this extraordinary and tragic event. Having spent some time looking over the disaster I thought I would condense my analysis. Our thoughts are with the 1000s of people affected.
The analysis below benefits from much public discussion of the event by other experts. In particular, I point to early analysis by Dan Shugar, Shawn Willsey and Philip Prince. Any errors below belong to me.
Initiating as a progressive creep failure throughout the first eight months of 2026 (or perhaps earlier), the mass experienced a catastrophic release on August 26, 2026. The model presented covers the first 22km of the event from source to the Border station at Rasuwagadhi. Over this distance the event transformed from a solid rock-ice slope collapse – (sturzstrom*, Pahiro) – into an ultra-fast, highly bulked, hyper-mobile debris flow. Five phases are defined (Figure 1).
(12/9/2026 *Sturzstrom – As Shawn Willsey points out use of this term in this analysis is not as it is generally applied. Sturzstroms are incredibly large rock avalanches with very long runs outs onto flatter ground. The Nepal rock failure was into a highly confined area, then downslope where the rock and ice debris mixed, the ice melted and the mass transitioned into debris flow. The word accurately paints the image of flying rock “Sturz” (fall, crash, or plunge) and “Strom” (stream, torrent, or river)! The Nepalese term for landslide is (Pahiro): Nepali word for a landslide, which often triggers rock-heavy floods in the Himalayas – perhaps this is a more appropriate term, or … “ठूलो पहिरो बगेर लेदो आएको” (Thulo pahiro bagerra ledo aaeko), which means “a massive landslide washed down and turned into a thick slurry flow.”)
(12/9/2026 – Geology-Google imagery from 2017/2026 provides a clear picture of the bedrock area. It appears to be an area of gneiss with intervening leucogranite sills. The bulk of the rock appears to be a banded gneiss, though. Layering across the front face has a sub-horizontal orientation. There are numerous defects visible – joints/faults/metamorphic foliations with various orientations – the bulk of the bedrock appears highly fractured. The brown colouring of the failure surface in drone images post event indicates considerable weathering, and weakening of rock along this plane, consistent with longer term development through water infiltration, freeze thaw cycles and erosion.)
Figure 1. Google earth images showing location of landslide phases discussed in text. Phase 0 in source area.(12/9/2026 – image updated)
Phase 0: Pre-Failure Progressive Creep and Collapse
The disaster is inferred to have initiated early in 2026 (or earlier) through progressive structural degradation along a 45° discontinuous defect (joint or fault) in the bedrock gneiss, leading to total collapse on August 26, 2026. Several stages of collapse are expected following generalized models for large rock failures (eg https://doi.org/10.1139/t02-085).
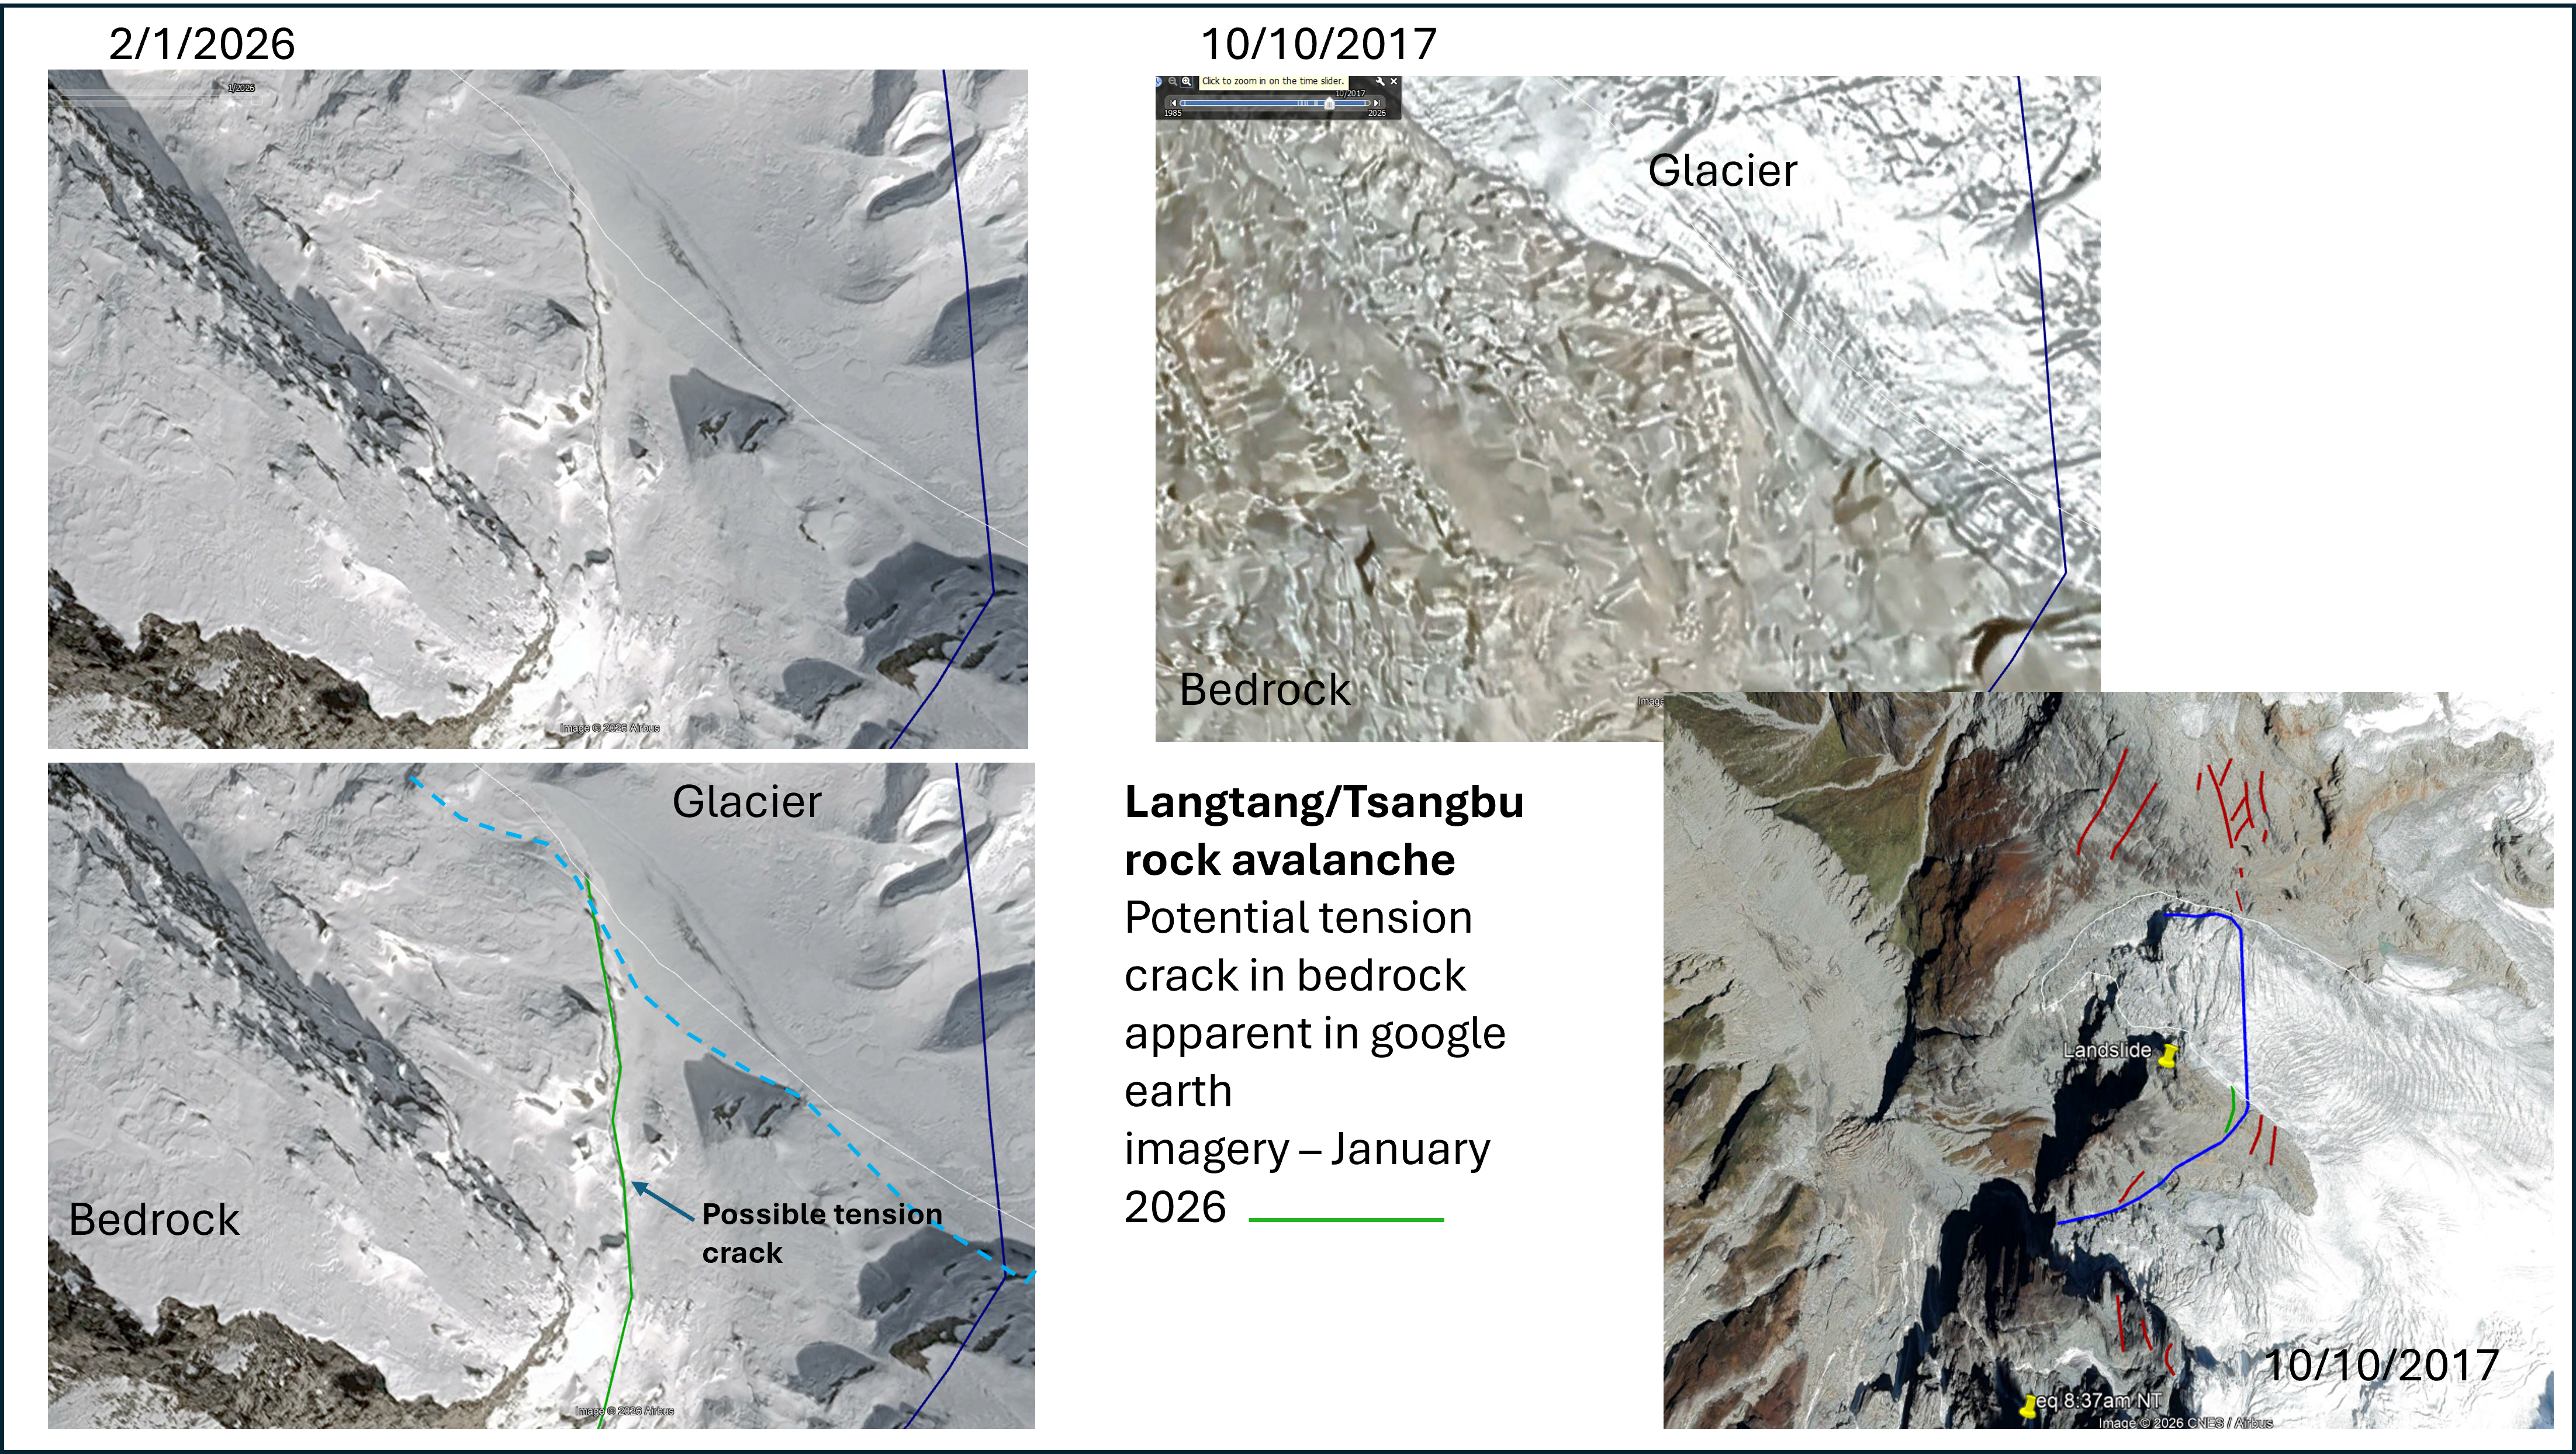
The Frictional Steady-State (January – May): Instability initiated in or prior to January 2026. Google images covering the bedrock from January 7, 2026 show linear features along bedrock defects suggestive of tension cracks (Figure 2). These may be simply due to snow accumulation on linear bedrock features or snow depressions caused by movement on recently formed tension cracks. Further analysis is required to establish whether they are early indicators of movement. It is possible movement was initiated earlier.
Figure 2. Google earth imagery 7/1/2026 and 10/10/2017. Linear features following bedrock defects are suggestive of presence of tension cracks.
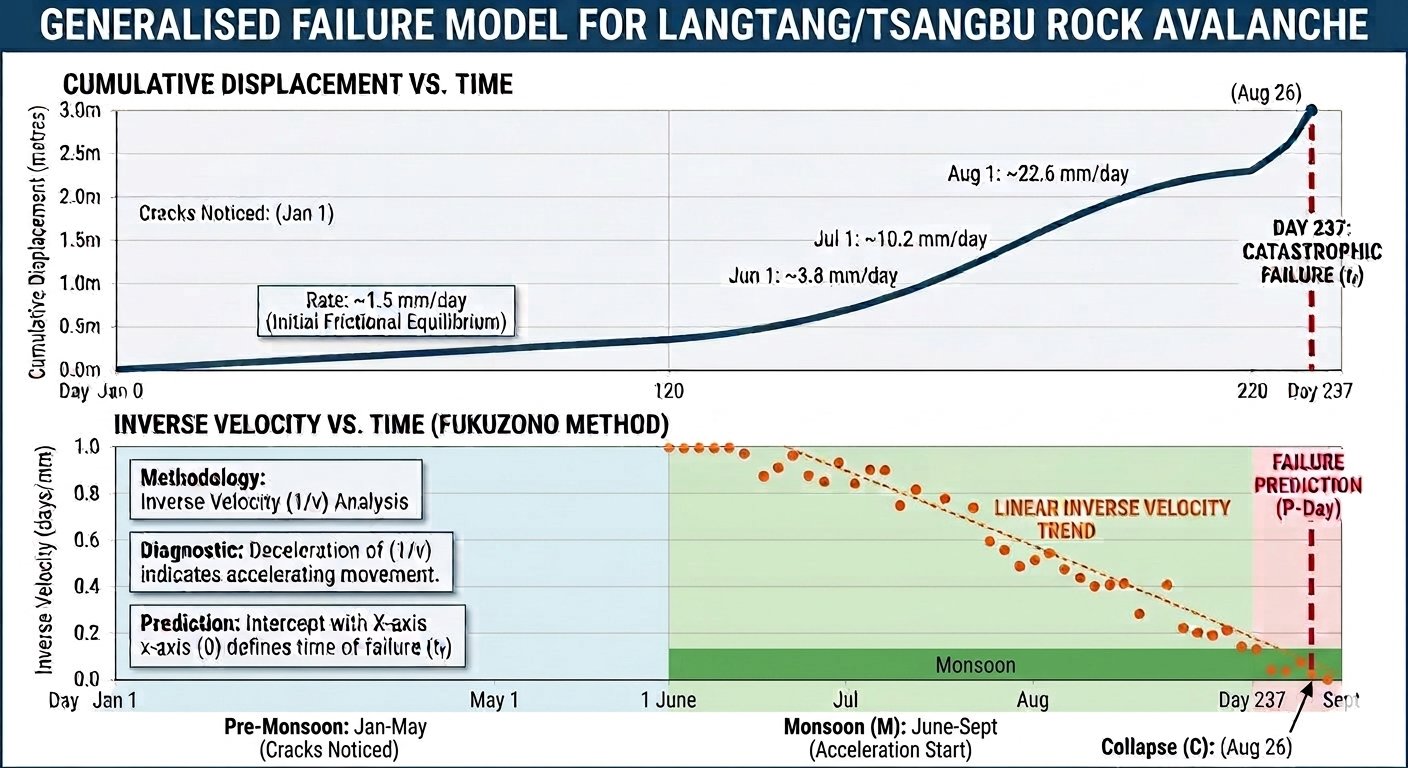
Under a generalized model during this early Pre-Monsoon period, the rock mass remained in a secondary creep phase, perhaps moving at a stable rate of ~1.5 mm/day. Sub-surface ice within the bedrock joints acted as a structural binding agent, keeping the mass in a temporary state of equilibrium.
The Onset of Acceleration (May 1 – June 1): As temperatures rose during the late Pre-Monsoon spring thaw, meltwater began infiltrating deep structural fissures, elevating internal pore-fluid pressures. The rock mass likely broke its linear displacement trend in early May. Intact rock bridges supporting the mass began failing in shear, driving creep velocity to ~4 mm/day by early June.
The Monsoonal Hyper-Acceleration (June 1 – August 25): The arrival of the continuous monsoon on June 1 introduced an unbroken, multi-month window of precipitation. Water infiltration flooded now open tension cracks, driving pore pressures to critical levels and drastically reducing effective friction along the main 45° failure plane. Displacement likely accelerated over this period with indicative values in order of 10 mm/day by July 1 and 20 mm/day by earlyAugust. By late August, the slope transitioned into an uncontrollable asymptotic tertiary creep runaway, with displacement velocity accelerating exponentially to over 400 mm/day by August 25.
Catastrophic Release: On August 26, 2026, the remaining structural rock bridges experienced total failure, instantly transitioning the static slope into a dynamic 132 million cubic metre sturzstrom*.
A graphical representation of suggested movement phases is shown in Figure 3.
Figure 3 Generalised displacement – time model for large rock slope failure applied to Langtang/Tsangbu rock avalanche. Acceleration driven by monsoonal rains and increased summer temperatures. AI generated.
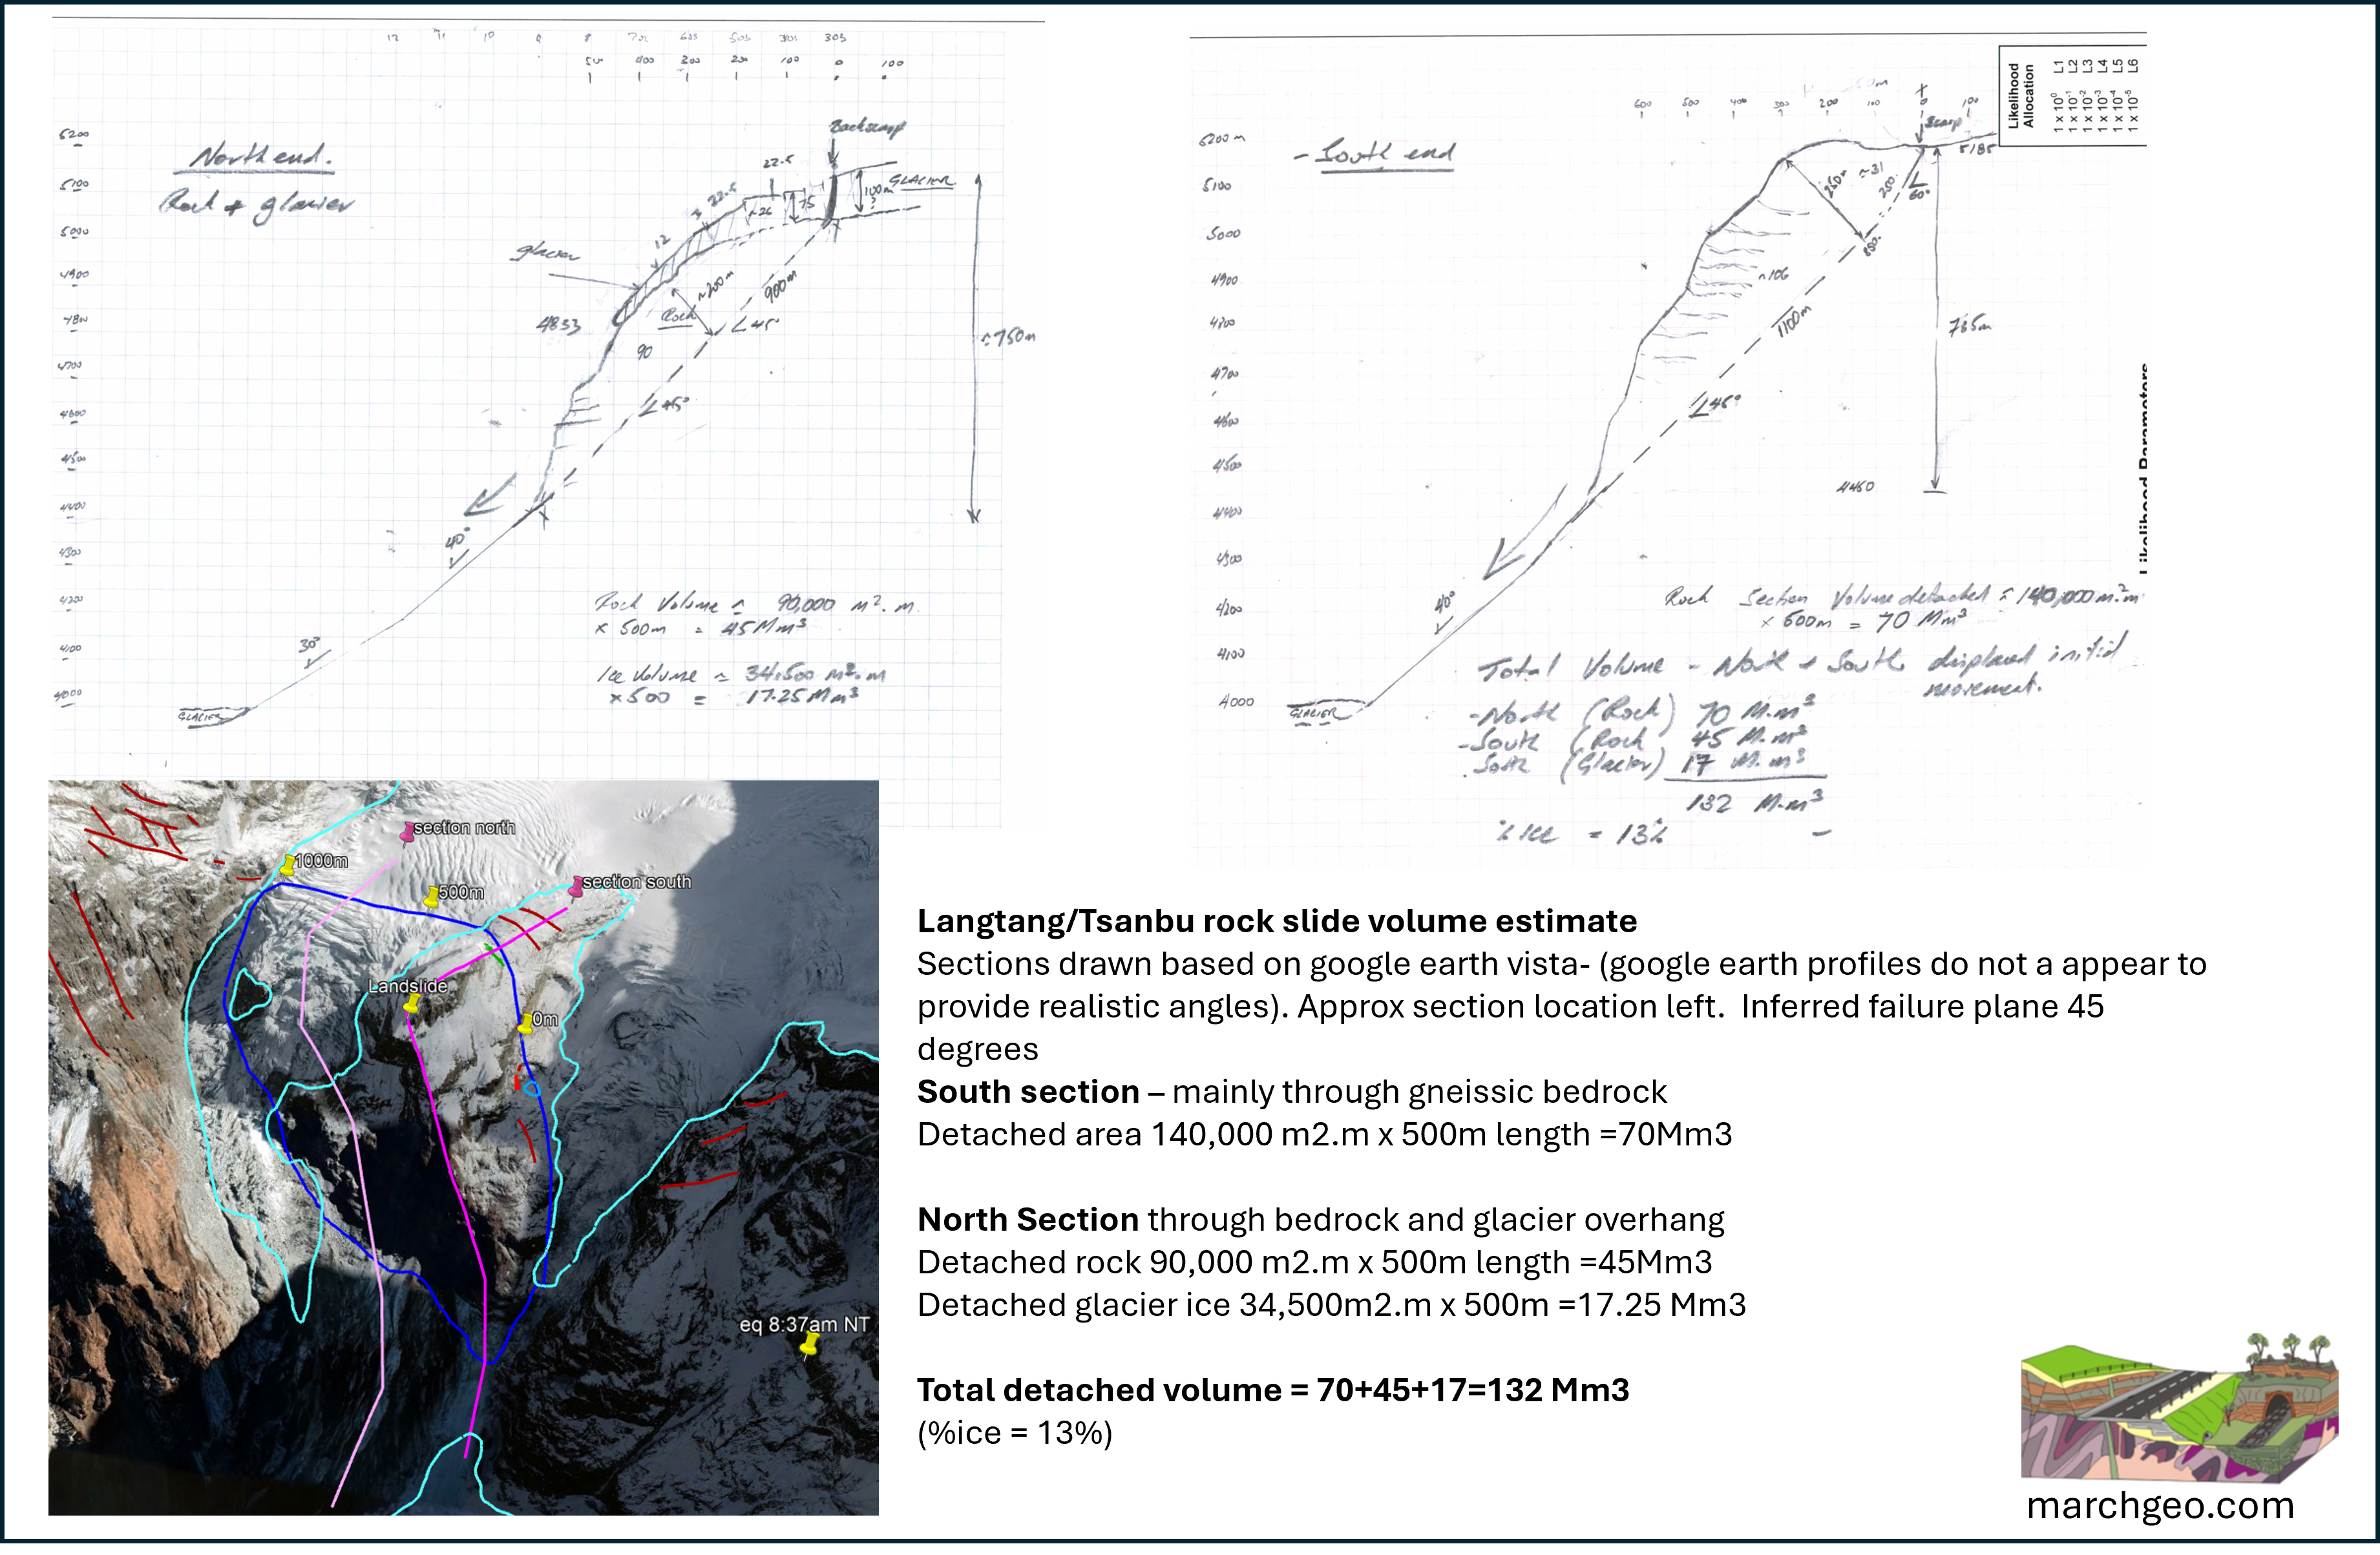
The sudden release of the 132 million cubic metre mass—comprised of 87% gneiss rock and 13% ice by volume—plunged 1,200 vertical metres down the steep slope, releasing 3.84 × 10¹⁵ Joules (3.84 Petajoules) of gravitational potential energy (Figure 4 and 5). The failure has a general translational/ wedge style mechanic bound by structural defects. The area under the glacial – north side – appears to have failed at an earlier stage – perhaps also as a large rock slide, or incrementally in smaller sections. The area of rock appears to taper to the north, under the upper glacier. This phase takes a few seconds!
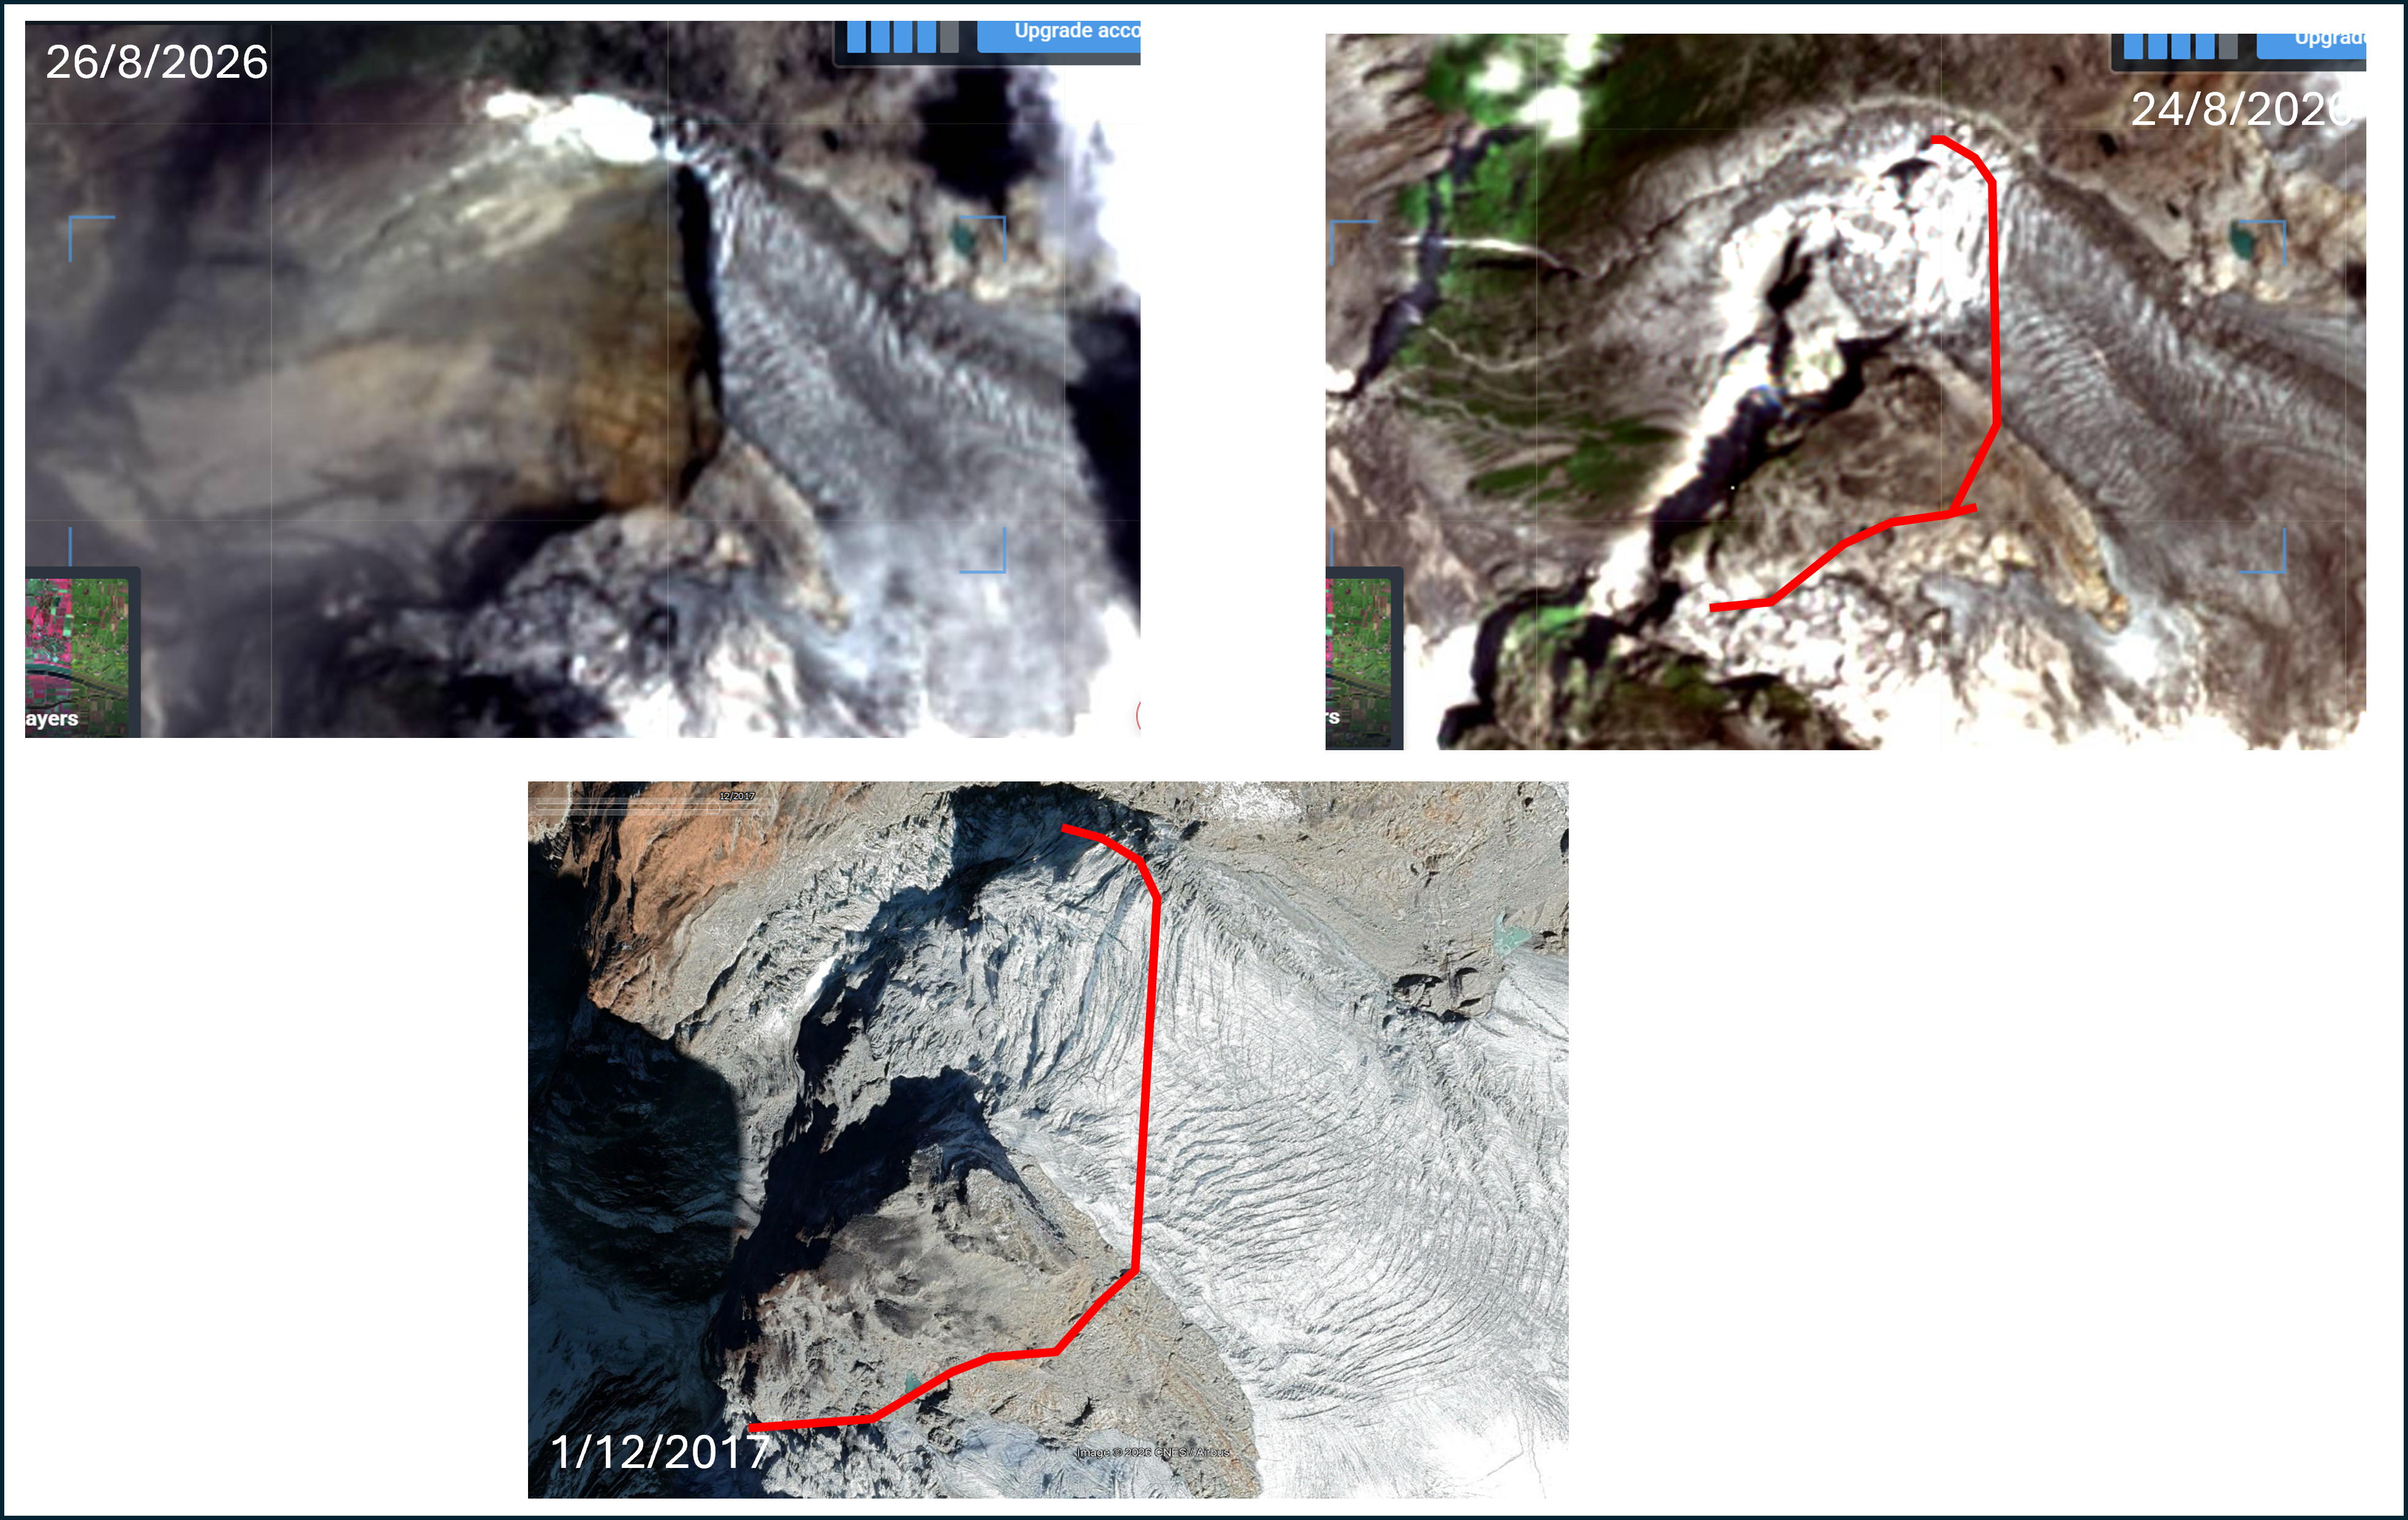
Figure 4. Satellite imagery pre and post event and google earth imagery – backscarp to failure indicated by red line.
Figure 5 Cross sections and volume estimate for Langtang/Tsangbu rock avalanche – initial ice content put at about13%
Impact Seismicity & Flash Melting: Upon striking the hard rock valley floor, the immense impact generated a magnitude 5.2 earthquake. Accounting for a seismic efficiency of 0.1% (3.98 × 10¹² J radiated as seismic waves), the remaining 99.9% of the total potential energy converted instantly into frictional heat and mechanical rock crushing. This thermal energy flash-melted 11.5 billion kilograms (73.2%) of the internal ice into liquid water.
Opposite Slope Run-Up: Driven by severe forward momentum, the mass surged 500 metres up the opposite 45° valley wall and slid back down. This U-turn generated an additional 3.39 × 10¹⁴ to 6.78 × 10¹⁴ Joules of frictional work. The shearing action liquefied another 1.02 to 2.03 billion kilograms of ice. By the time the avalanche returned to the valley floor for the second time, 86% of its original ice assets had converted into liquid water.
Phase 2: Glacial Chute Entrainment & Acceleration
Rebounding off the opposite wall, the avalanche entered a 2-kilometre-long remnant glacier chute with an estimated average thickness of 15 metres with approximate slope of 25°.
Mass Bulking: Assuming a representative flow path width of 500 metres, the massive shear forces at the base of the flow completely scoured and incorporated the glacier, entraining an additional 15 million cubic metres (1.38 × 10¹⁰ kg) of ice into the landslide matrix.
Chute Acceleration: The vertical drop down this 25° glacial chute released an additional 2.76 × 10¹⁵ Joules of potential energy. Intense rock-on-rock grinding and fluid turbulence melted up to 8.26 billion kilograms of ice entrained by the lower glacier.
Velocity Metrics: Highly lubricated by the basal melted ice slush, the flow rapidly accelerated to a terminal velocity ranging between 75 and 125 metres per second (270 to 450 km/h). At the exit of the 2 km chute, the total moving volume stood at 147 million cubic metres, with liquid water comprising 9.8% to 14.3% of the flow by volume.
Phase 3: Intermediate Valley Flattening & Complete Liquefaction
The flow exited the steep glacier chute and entered a 4-kilometre-long intermediate valley section characterized by a constrained width of 300 metres and a gentler 10% average slope.
Deceleration Profile: The sharp drop in gradient and high boundary resistance of the 300-metre wide channel slow the flowing mass. The flow shed its excessive entry velocity, settling into a stable, slope-dictated terminal velocity of 25 to 40 metres per second (90 to 144 km/h).
Phase Transition to Debris Flow: The continuous grinding down this 4 km stretch released enough frictional heat to flash-melt 100% of the remaining ice within the matrix. Total liquid water rose to 29.5 billion kilograms. This completed the mechanical transition of the disaster from a rock avalanche into a fluidised debris flow with a water content of 8.7% by mass and 20.4% by volume.
Phase 4: Confined River Canyon & Intense Soil Scouring
In this section, the debris flow entered the Lhende River and surged into a steeply confined valley for a distance of 14 kilometres on an average slope of about 12%. The flow hit the Lhende head on ramping up over 400m on the opposite slope before turning downstream.
Hydro-Dynamic Interaction: Assuming the canyon contained an active river flowing at 20 m³/s. Over the brief duration of the surge event, the river contributed roughly 150,000 metric tonnes of water—a negligible addition to the existing 29.5 billion kilograms of water, resulting in no meaningful fluid dilution.
Re-Acceleration: The narrow canyon walls prevented lateral spreading, causing the flow depth to swell to an estimated 25–35 metres. This severe vertical bulking reduced relative basal drag, allowing the flow to re-accelerate to a terminal speed of 30 to 45 metres per second (110 to 160 km/h) as it passed the border station.
Debris Erosion & Final Fluid Composition: The high shear stress of the deep flow aggressively scoured the canyon floor, entraining an estimated 2,000 cubic metres of soil and rock debris for every metre travelled. This process added 28 million cubic metres (75.6 × 10⁹ kg) of material to the avalanche. Accounting for a 5% ambient water content by mass within the scoured valley soil, an additional 3.78 billion kilograms of liquid water was injected into the flow alongside the dry solids.
Summary of System State at Rasuwanadhi Border crossing point
Parameter
Metric Value
Analysis & Physical Significance
Total Moving Volume
175 million m³
A 32.5% increase from the initial collapse volume via intense glacier and valley floor erosion.
Total System Mass
4.16 × 10¹¹ kg
416 million metric tonnes of moving rock, scoured soil, and fluid.
Total Liquid Water Mass
33.43 × 10⁹ kg
Derived from the complete melting of all initial and entrained ice, river volume, and soil moisture.
Exit Terminal Velocity
30 to 45 m/s (110–160 km/h)
High-velocity fluid motion capable of total structural destruction upon impact.
Final Water Fraction (Mass)
8.0%
The mass proportion of liquid phase to solid phase across the bulk slurry.
Final Water Fraction (Volume)
18.7%
Nearly one-fifth of the total volume exists as a liquid matrix, maintaining fluidization.
Discussion
Timing: The earthquake resulting from the landslide was felt at 8:37am Nepal local time. CCTV at the China/Nepal border crossing (destroyed by the debris flow) has a time stamp of 10:59:49 (China Standard Time) = 8:44 am Nepal local time as the flow arrives. This leaves no window for a dam to form – the flow was continuous for the full length. Incredibly, the struzstrom*/debris flow covered the approx. 21.2km down the Lhende River from the landslide source in just 7-8 minutes! Average velocity of the flow for this section, from source to border station, then is estimated to be about 160 km/h – 180km/h.
Water volume: The model presented above accounts somewhat for potential water sources and required volume to sustain a debris flow. The initial estimate of ice volume of the upper glacier does not appear sufficient to sustain a debris flow on its own, and without addition of water from the lower glacier it is conceivable that the event could have remained dominantly a “dry” rock avalanche and been stopped in the upper reaches of the Lhende River creating a massive landslide dam.
Runout for very large volume, dry landslides is proportional to the square root of the starting volume. Based on a detached volume of 132Mm3 the runout would be expected to be about 11km on a flat surface. If it did not turn into a debris flow and remained mainly a rock avalanche this dam would have been huge and would have threatened development downstream – there would have been more warning time.
With the addition of water from melting of the lower glacier total water volume available shifts to the 20% range and a debris flow can be sustained. It is interesting to note that water in the river did not add that much to the overall water content.
More detailed analysis is required to more accurately assess the rock and ice volume involved in the event.
Transition from Rock/ice avalanche to debris flow: There appears to be sufficient kinetic energy in the system to provide for complete melting of any entrained ice prior to the flow reaching the Lhende River. The transition from rock – ice avalanche to debris flow likely occurred in the valley below the lower glacier.
Comparison to other large landslides:The Chamoli Landslide (https://science.sciencemag.org/content/early/2021/06/09/science.abh4455) in India in Feb 2021 shares many features with the Langtang/Tsangbu rock avalanche and debris flow event. Chamoli was 27Mm3 in volume (~5x less than Nepal based on estimates above) with a debris flow run out of over 17km. Chamoli had a starting rock/ice ratio with 20% ice and kinetic energy turned this to water in the initial fall perhaps providing for more rapid transiton to a debris flow. Both highly destructive events. There were also indications of precursor movement at Chamoli.
Any warning?: Large rock falls of this nature do not generally occur without precursor movements. It appears that if movement had been detected much earlier in 2026, the area could have been monitored in more detail, similar to events preceding the Blatten Landslide in Switzerland in May, 2025. Follow-up on potential cracks suggested in Imagery from early January is required to determine when movement initiated.
In my view it would have been incredibly difficult to accurately predict the behaviour of the Langtang/Tsangbu rock avalanche event. Early warnings allowing people to get out to higher ground would have been substantially reduced the toll. There were some seismic signals detected prior to 5.2M seismic event that marked the collapse. Recognition of these (given they are connected to the event) may have provided more warning time downstream. It appears that a wider network of seismic stations in the region may assist in earlier recognition of these events. There is a risk of false positives that could have a huge disruptive effect. This requires much more detailed investigation.
The Himalayas are vast and monitoring rock slopes represents an immense challenge. Remote monitoring of rock slopes via InSAR or other satellite technology to catch events like this is feasible but would require substantial resources to setup. For the Himalayas a cooperative centre for “mountain movement” could be established with resources from China, India, Pakistan and Nepal and other partners. The process of systematic comparisons between datasets to detect slope movement is perhaps something an AI could be trained to do, to speed up the process – flagging issues for more detailed expert analysis and potential follow-up. Or local higher-risk areas could be flagged for detailed satellite monitoring to reduce the scale of the task. This would also help identify other hazards (eg GLOF). This requires substantial further investigation but would certainly help reduce the human toll of such events.
Future development in the high Himalayas needs to take these events into account. There is already too much infrastructure exposed.
This event represents an immense human tragedy. We need to learn from it to reduce the impact of future events like this.
Management of the closure of Wolgan Valley Road is excelling as a case study in mismanagement and failure of current policy and processes involved in repair and remediation of landslides in NSW. This matter is of considerable public interest given the costs of the closure – likely running over $200M in lost income to businesses and the prolonged closure that has severely impacted the Wolgan Valley Community. It also impacts repair of many other landslides in NSW that have occurred over the last 5 years and the management of future disaster events. It is clear that the processes are deeply flawed and the public are not getting value for money. There are lessons for government and industry to learn if they are prepared to listen. These matters are discussed below as a matter of public interest.
The saga started with a slope risk analysis that resulted in the road being closed in August 2022 and subsequently over $8M being spent on investigation and design of alternative routes. Short term access into the valley along the 4WD Donkey Steps Track cost around $4M to construct. The DRFA application to the NEMA by Lithgow Council claimed it would cost over $1 BILLION to repair the old road. This claim was lampooned in the press as a “Billion Dollar Blunder“, yet somehow it appears it got agreement from TfNSW. As of January 2026, Wolgan Valley Road remains officially closed, but is being used by locals, and council contractors, especially by heavy vehicles for work in the valley.
These reports were supposedly reviewed by experts in Transport for New South Wales. I was interested in seeing the nature of these expert reviews, especially given the damning review of the initial risk assessment by GHD, and GHD’s new risk assessment that pointed to a difference in the range of 4 orders of magnitude in assessed landslide risk.
There is also the huge disparity in estimates to repair the old road to explain. Initial advice pointed to around $60M to achieve a tolerable risk target, but this blew out to the incredulous figure of over $1 BILLION in the DRFA application. Estimates by landslide remediation specialists Geovert indicated $203M to reconstruct the road meeting DRFA conditions, and my own assessment to achieve an ARL3 target indicated about $80M (this was very conservative!). The $203M estimate from Geovert was a fixed price bid and was not considered by either Council or Transport. Why? How is this vast range in costs explained by TfNSW who approved the $385M application that claimed the $1 BILLION figure?
On 21/2/2023 Lithgow council requested TfNSW provide a technical review of a WSP report about slope risk on Wolgan Valley Road. Council do not have in house geotechnical experts and were relying on TfNSW to provide an accurate and expert opinion: “Please find attached Part 2 of the report on Wolgan Road, comprising a detailed Slope Risk Assessment relating to the asset. Council will undertake its review, however, as discussed previously, it would be greatly appreciated if Transport for NSW and Public Works NSW could also review and give their expert commentary and advice accordingly.”
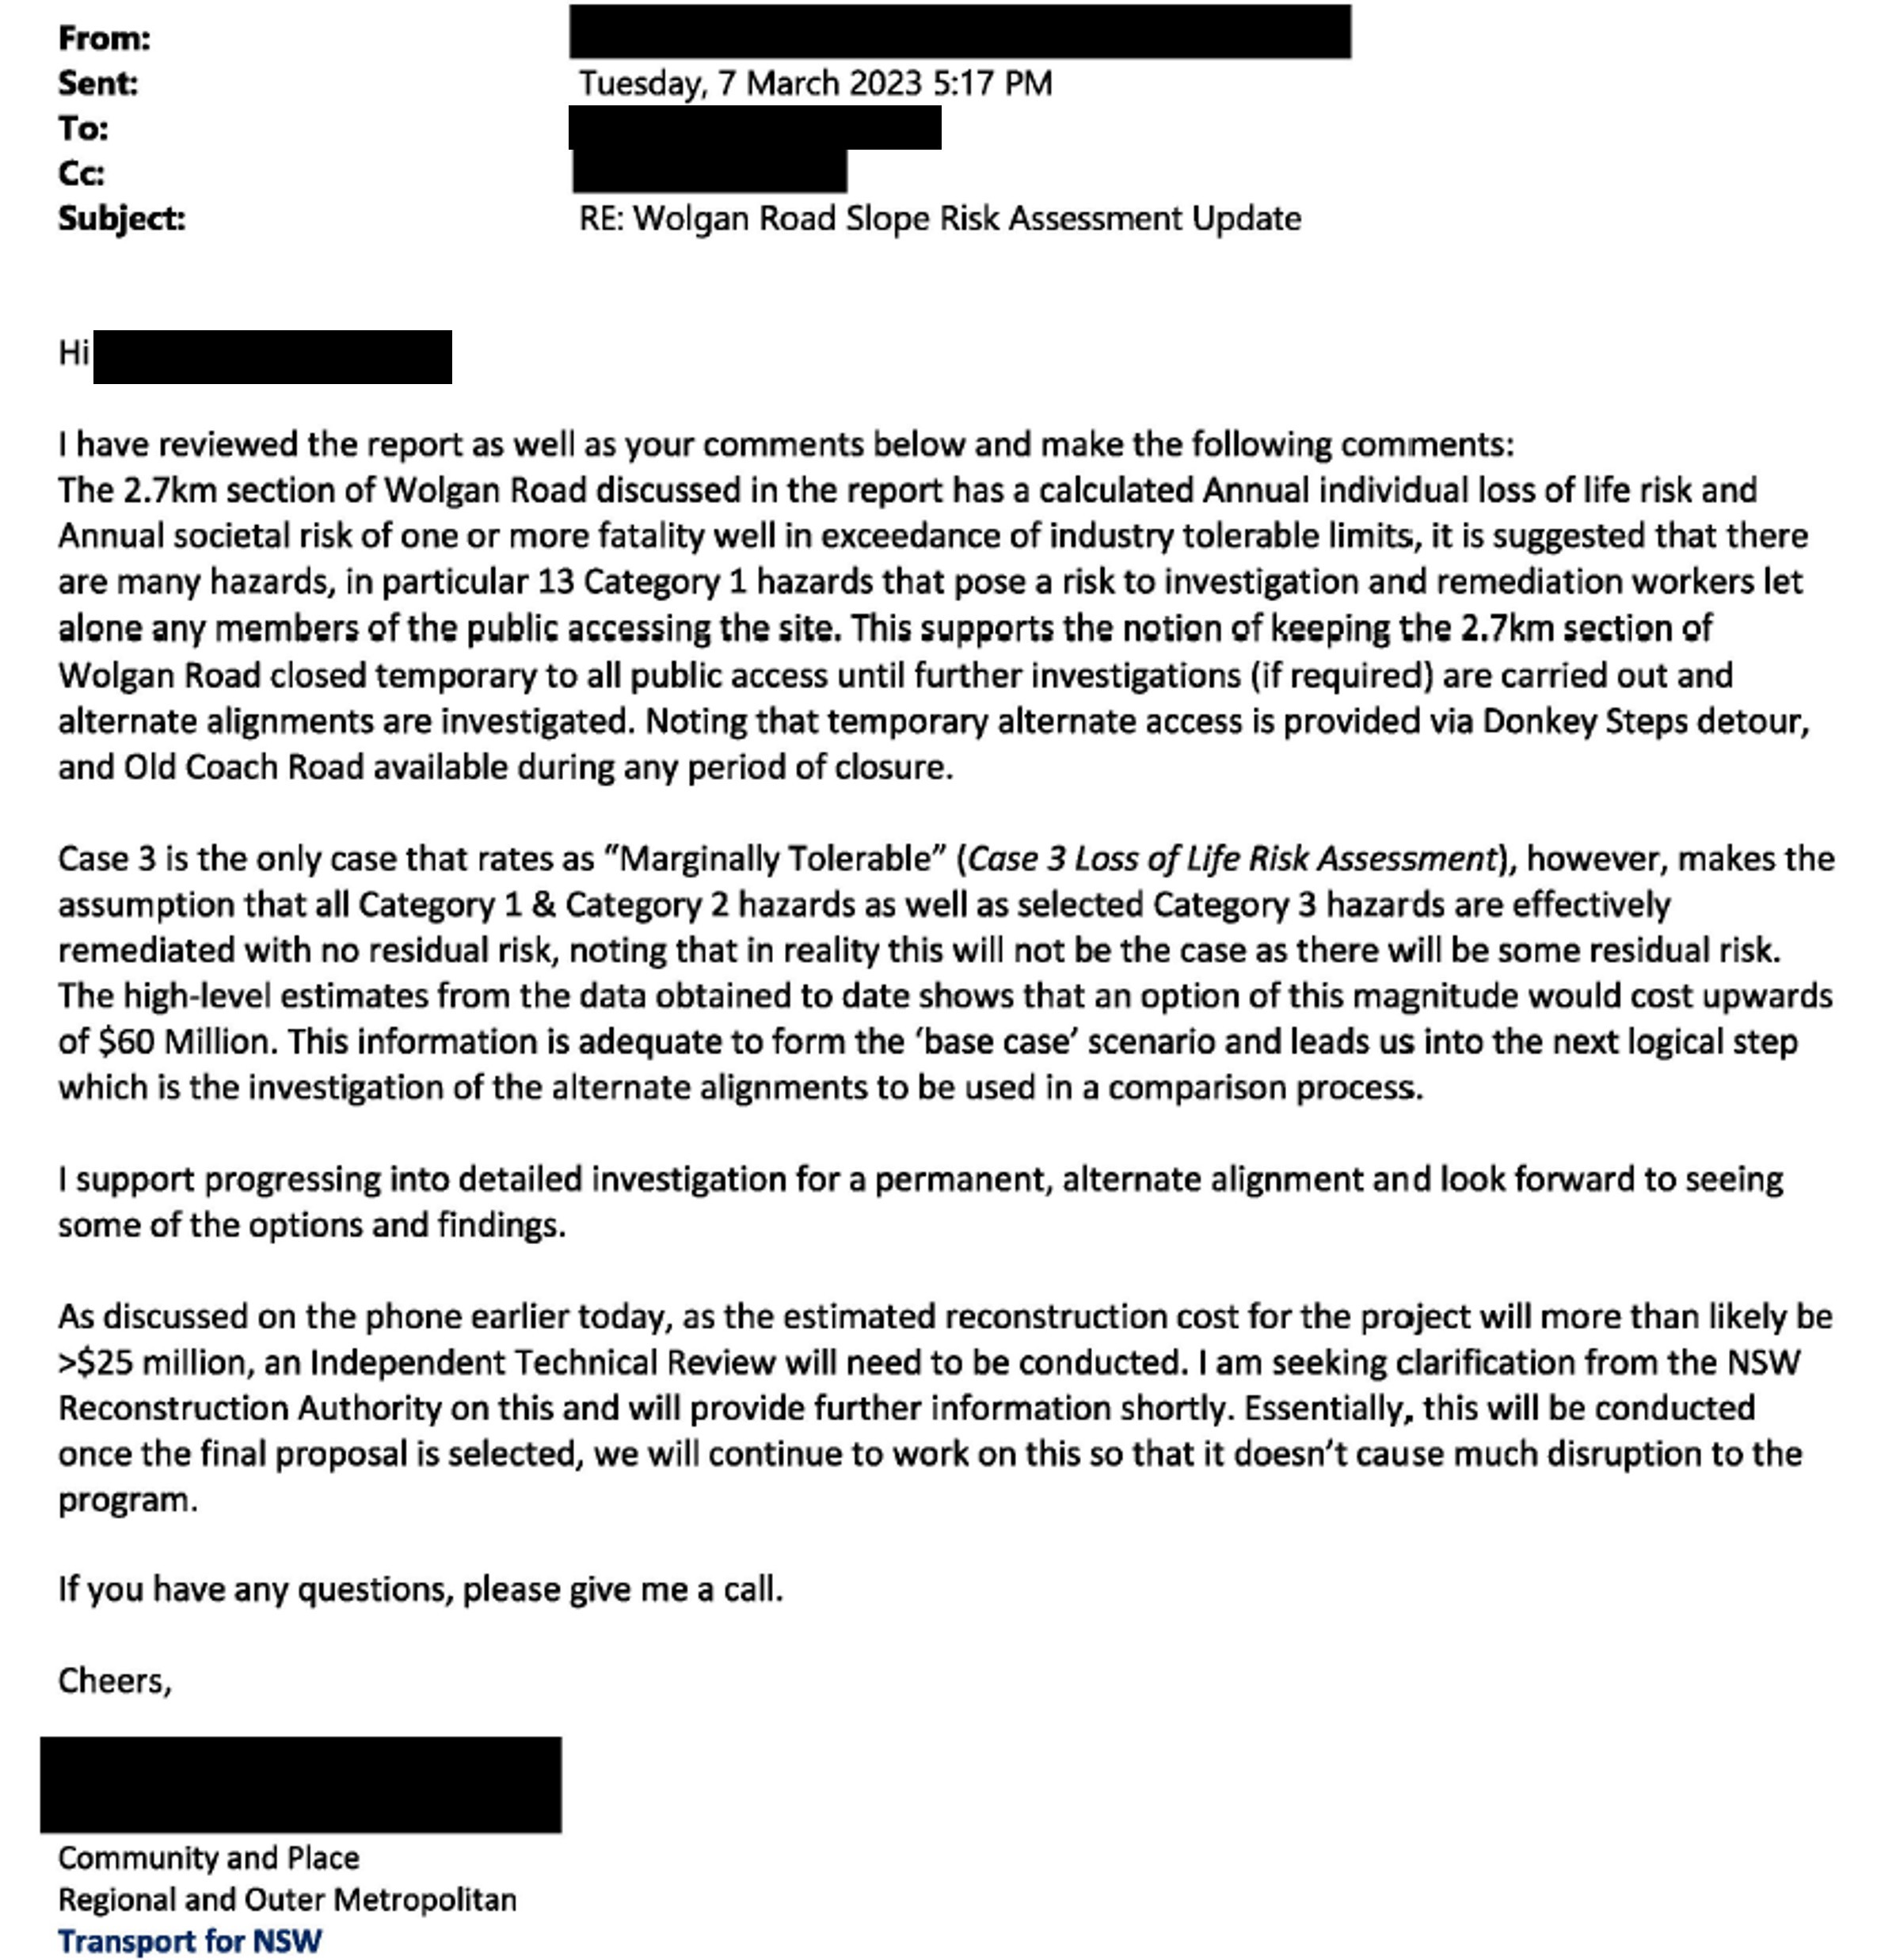
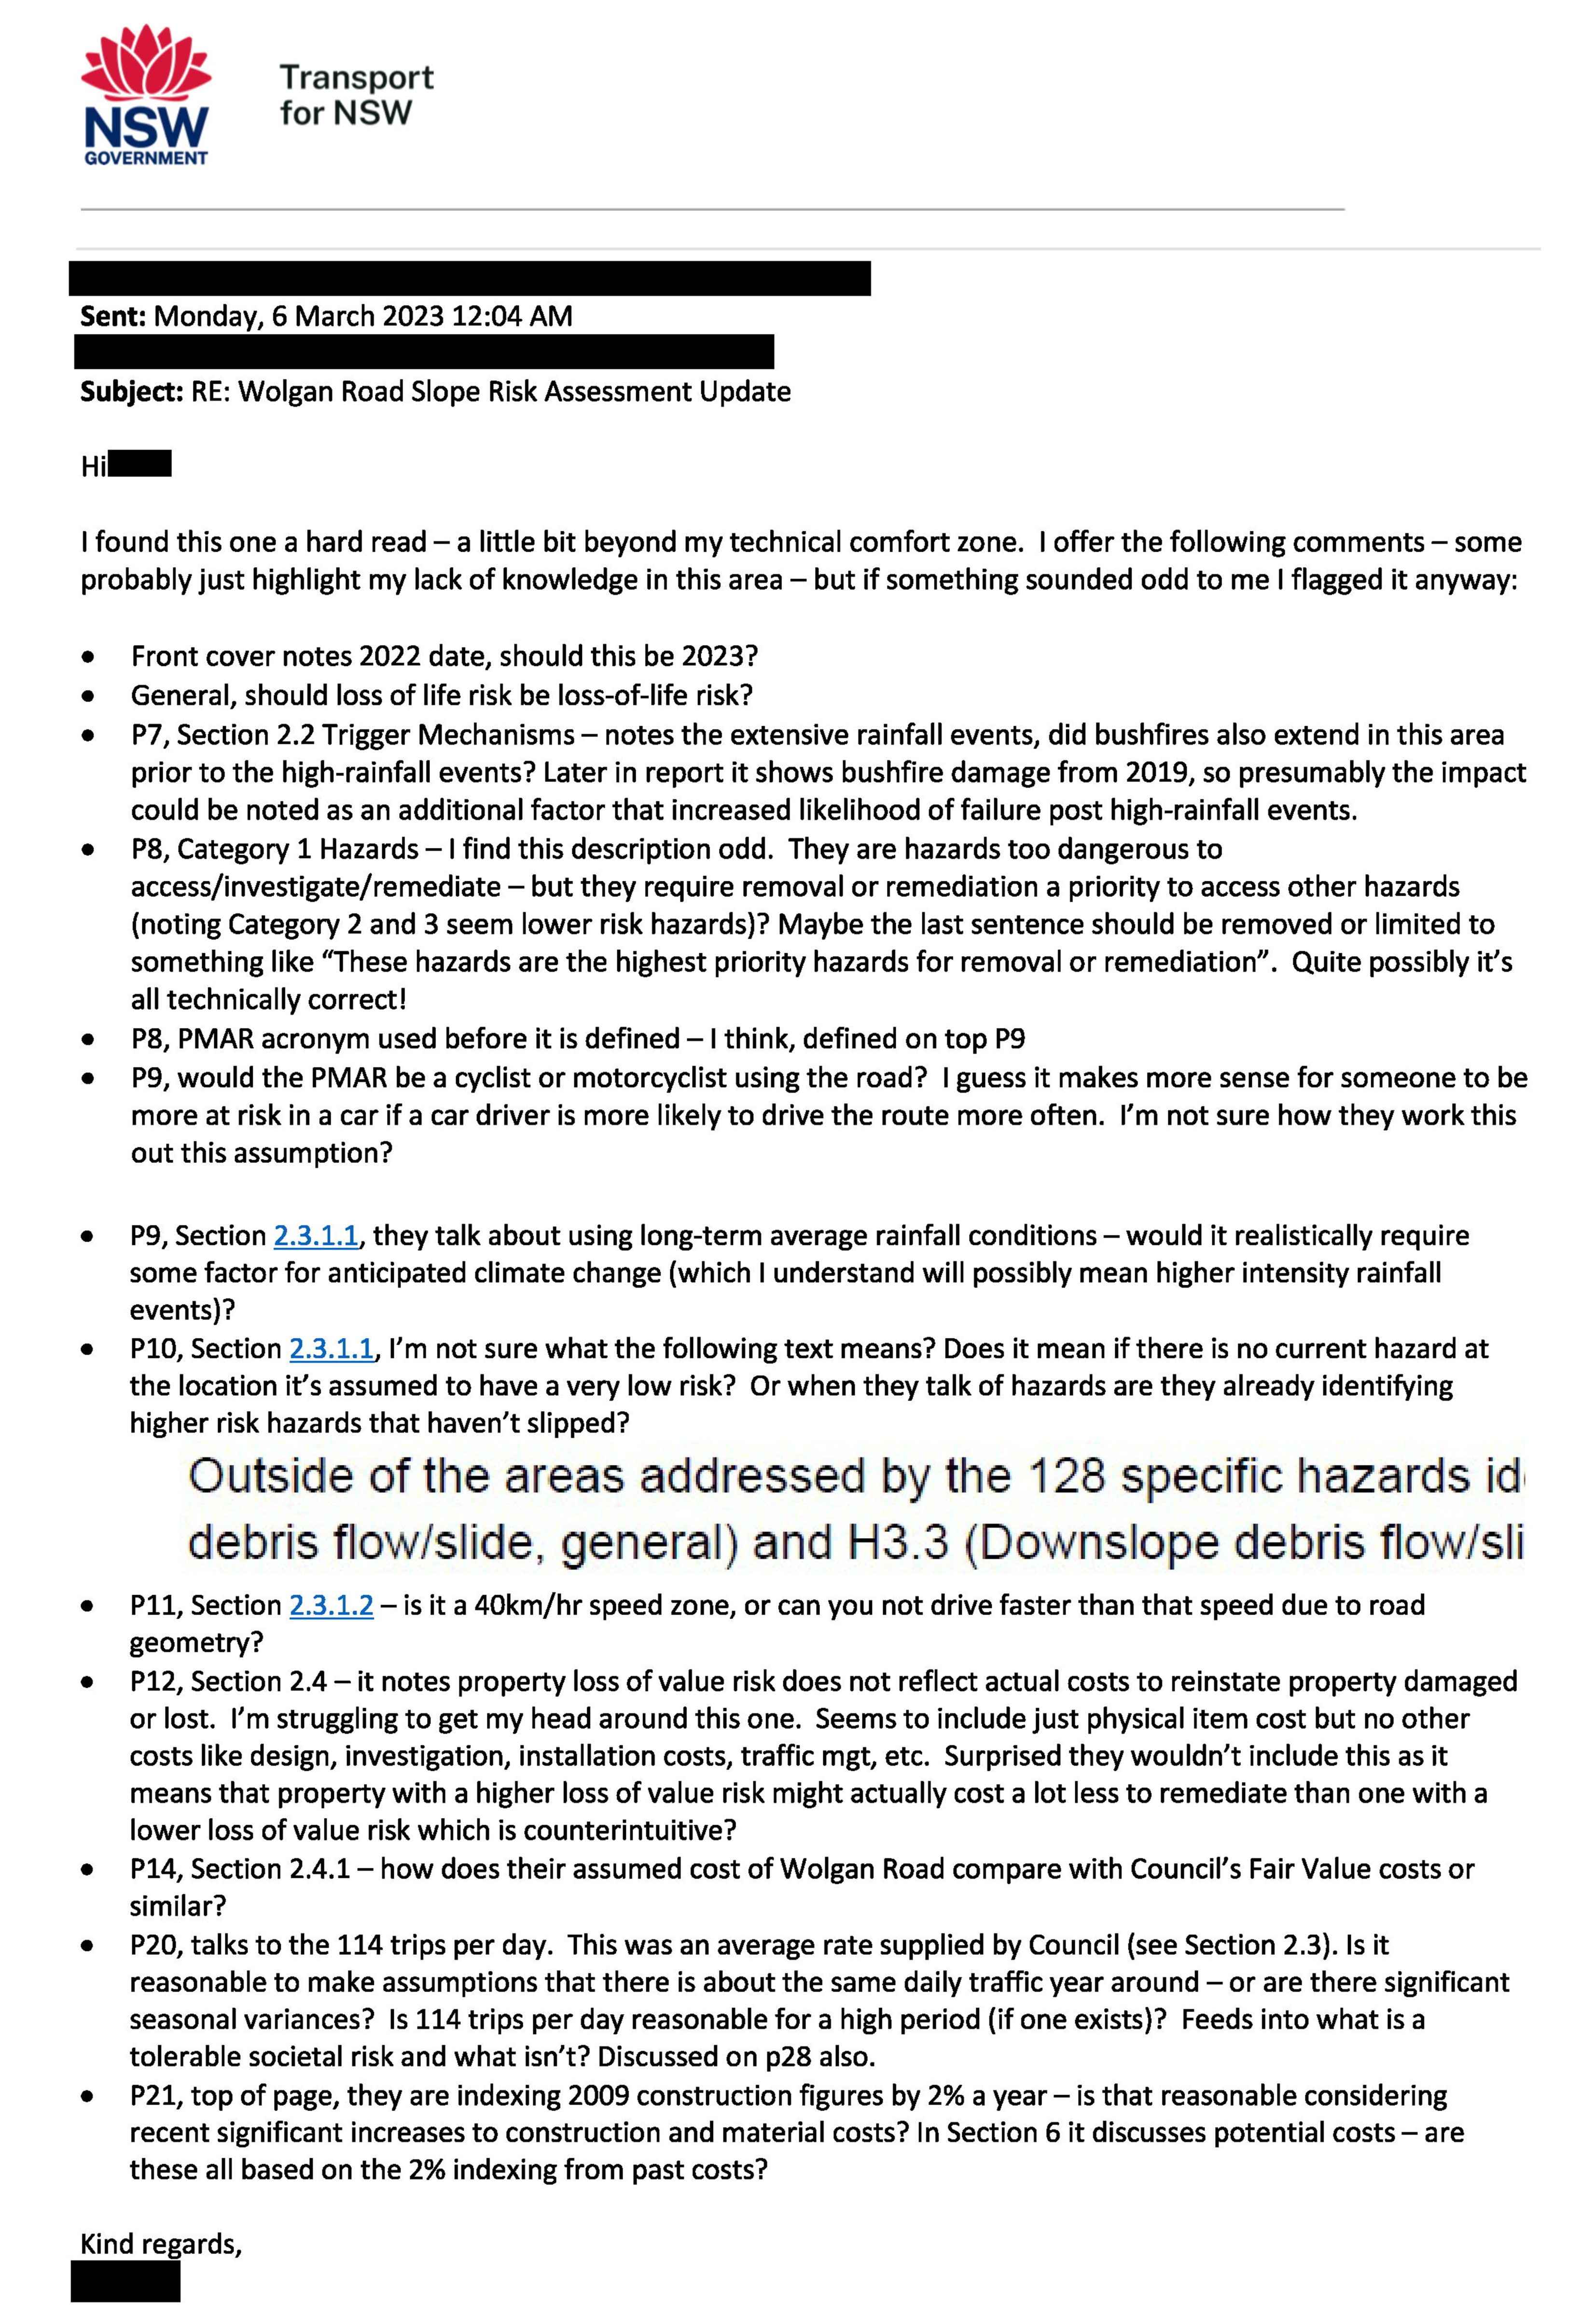
Council requested “expert commentary”. I requested a copy of this “expert” advice from Lithgow council and they provided the following from TfNSW below. I have redacted the names.
Are these emails the basis of TfNSW “expert” commentary? The first does not provided critcal commentary on the methodology used, merely accepts the report’s findings and explicitly gives the go-ahead for investigations on the new route. The second is superficial, reflecting the writer being “beyond my technical comfort zone” and not having the requisite expert knowledge. Neither of these constitutes “expert commentary”. See GHD’s expert review for how this should have looked.
Was further “expert” advice provided by TfNSW? What of the technical reviews of the DRFA funding application that suported the astonishing figure of $1 Billion to repair the old road – how did TfNSW review this document?
Seeking answers in December 2025, I submitted a GIPA request to TfNSW seeking the following:
Item 1. On 21/2/2023 Lithgow council requested TfNSW provided a technical review of a WSP report about slope risk on Wolgan Valley Road: “Please find attached Part 2 of the report on Wolgan Road, comprising a detailed Slope Risk Assessment relating to the asset. Council will undertake its review, however, as discussed previously, it would be greatly appreciated if Transport for NSW and Public Works NSW could also review and give their expert commentary and advice accordingly.” Council requested “expert” commentary; however “reviews” provided by TfNSW to council were not completed by experts. I am seeking copies of any additional review or commentary of the WSP report by staff from TfNSW provided as reports, emails or other forms of correspondence. If no such expert review was undertaken, then please confirm this was the case.
Item 2. In July 2025 Lithgow Council were awarded $385M to restore access to Wolgan Valley. The award was based on a report provided to council by consultants WSP. I am seeking copies of any review or commentary of this WSP report and Lithgow council submission to the NEMA by staff from TfNSW provided as reports, emails or other forms of correspondence.
On January 23,2026 TfNSW replied to my GIPA request:
“I have decided to refuse to deal with the application under section 58(1)(e), in accordance with section 60(1)(a), for the reason that dealing with the application would require an unreasonable and substantial diversion of the agency’s resources.”
These are pretty specific requests. TfNSW claimed it would have to look through 1000s of emails and it would take over 40 hours to fulfil them! Not surprisingly, I have requested a review from the NSW Information Commissioner (wait and see).
I recently received a reply from Jenny Aitchison MP (NSW Minister for Roads) to my cost estimate for repairs of the old road sent to the government in October last year. Given the reply to my GIPA request from Transport, I was encouraged by this statement from the Minister:
“I appreciate the ongoing interest in this project and the desire to see progress guided by robust evidence and sound technical assessment. Transport for NSW remains focused on supporting a transparent and methodical process that considers all viable options and supports timely decision-making.”
I highlight the words “transparent” and “timely”. Based on mine and the community’s experience, management of slope failures on Wolgan Valley Road have been neither “transparent” or “timely” and the sad saga continues to drag on. Perhaps the Minister will step in and approve the release of the information I seek? (I have asked her to look into it).
There are some salient lessons for TfNSW to learn from this experience, but it seems no one is listening.
Management of landslide repairs to Wolgan Valley Road has been a disaster. The road was closed in November 2022 and remains closed after three years of the sort of bureaucratic bungling made famous in the satire Utopia. It’s been a feeding frenzy for consultants with over $13.5 milion spent to get back to square one. I was asked to give a brief outline of some of the issues at recent community meeting and this is now available on youtube.
Just completed 115 slope assessments on the Alpine Way in southern NSW, with Matt Kilham. The package included mostly ARL3-5 slopes. The ARL5 slopes were first assessed when the wider slope assessment program commenced in 2005.
Many changes along the Alpine Way in that time including wide use of rock fall mesh to control rock falls from cuttings along the narrow road. Many corrugated steel culverts were found to be in less than satisfactory condition and some of these have resulted in changes to earlier ratings.
All in all an enjoyable 2 weeks in the bush. We stayed at Waratah House in Khancoban (see AirBNB).
I’m running as the Libertarian Party Candidate in the up coming Hornsby by-election on 19th of October.
LIBERTARIAN PARTY CANDIDATE FOR HORNSBY BY-ELECTION
The Hon John Ruddick MLC announces Geologist and author Marc Hendrickx will represent the party at the Hornsby by-election.
Marc has run an independent geological consultancy for the last 12 years (specialising in Landslide Risk Analysis) and is a long term member of the local RFS brigade. Marc and his family have lived in the Hornsby area for over 20 years.
Marc is a keen outdoors enthusiast and has been at the forefront in battling foolish, irrational government decisions which ban the public from our National Parks. He has written books on why Uluru/Ayers Rock and Mt Warning should be open to all. If these battles are not won then access to the pristine National Parks in Hornsby will come under threat.
Marc’s focus will be on putting local issues to the forefront and achieving positive outcomes for an electorate that has long been ignored by the major parties.
Slash red and green tape and state taxes to open up business opportunities in the electorate.
Let’s ensure our wild places are well maintained and remain open for all Australians
Ensure State Government focuses on the important stuff: Transport, Education, Health, and affordable reliable electricity and stays away from woke politics and agendas.
Poor planning has seen population growth along major corridors in the electorate being done without supporting infrastructure like roads, schools and recreational places. Let’s get a new high school to service the growing local population and not have our children travel for hours to get to school each day.
Develop a 30 year plan for sustainable growth for the electorate.
Sub-standard transport routes. Let’s fix the problem areas like Galston Gorge and traffic jams along New Line Road for good. What about a full interchange on the M1 at Mt Colah?
Increased autonomy for local RFS Brigades to better manage bush fire risk their local areas.
For NSW
Reduce state taxes and duties and free up more of your money to spend on things you need, rather than have government bureaucrats waste it through bad decisions, poor planning and poor management.
Slash red, green and brown tape to open up business and employment opportunities in Hornsby and the rest of NSW.
Ensure our beautiful wild spaces, our National Parks and State Forests are well maintained and remain open for all Australians.
Keep the government as small as it needs to be and focused on practical State issues and out of our day to day lives and away from woke causes.
Slash the back room bureaucracy who add no value to our state but cost us $billions. Redirect these funds to front line services, paying off our huge State debt and providing tax relief.
Provide the regulatory environment for investment in cheap reliable sources of energy.
We will put you in charge of your own health – we reject the over-reaction of the mandatory Covid measures that did great harm to our State, especially our youth.
Modify the NSW Land Rights Act 1983 to ensure Crown land remains in public hands and remains accessible to all.
Ensure National Parks stay in public hands and access is available to all Australians.
Remove recreational fishing licenses, you don’t need a nod from big brother for your family to cast a line.
Maintain our freedom of speech and thought by stripping fees to access government information and opposing legislation that cuts our right to speak.
Interview with Andrew Bolt on the Bolt report 5 August 2024, about the on going closure of an iconic NSW bushwalking experience – the Mt Warning Summit Track. How long can this nonsense go on for?
Mount Warning National Park provides one of the most outstanding experiences of the Australian Landscape on the east coast. Mount Warning was an immense shield volcano active 23 million years ago, and is now regarded as the best preserved and largest eroded shield volcano in the southern hemisphere. The original volcano was over 100km in diameter and likely reached over 2000m high. The 1159m peak of Mount Warning is the solidified remains of the main central vent of the volcano. 360 degree views from the summit to the Pacific Ocean beaches, the Tweed River valley and the surrounding forested ranges forming the caldera walls are simply extraordinary. Since a 4km track was constructed in 1909 over 3.5 million people – families, friends and individuals have made the journey to the summit to experience the exhilaration of the climb, the awe inspiring vista and for some, the joy of witnessing the first sunrise on the Australian Mainland.
More recently public access to the Park and Summit have become contentious as post-modernist political concepts have captured the minds of Park Authorities trusted with managing the Park on behalf of the Public. There has been a push to close the Park on the grounds public access offends some Aboriginal groups. Other Aboriginal groups challenge this belief, including those that have the closest connection to the mountain – the Ngarakwal People. The matriarch of this group, the late Marlene Boyd stated in 2007 “I do not oppose the public climbing of Mount Warning – how can the public experience the spiritual significance of this land if they do not climb the summit and witness creation!” This wonderful endorsement of what we all feel when we visit these remarkable natural places has been long ignored by the authorities.
A Guide to Climbing Mount Warning is a celebration of the Park and summit experience. The Guide is packed with historical information, facts and figures that demonstrate official views about the mountain in relation to environmental damage, safety and Aboriginal perspectives are fundamentally wrong. Moves to close the Park are more about politics and misconceptions about risk management. This flawed approach will result in a National Park that will have no visitors. Awe and wonder to be hidden behind a locked gate. This would be an insult to the millions who have climbed and those who worked so hard to create the Park in 1929 preserving this wonderful place and the adventure it holds for future generations to explore and enjoy.
Keen-eyed T4NSW maintenance supervisor Terry reported this very large rock on the Old Pacific Highway near Calga for engineering assessment. It had moved about a meter on clay softened during the recent rain events. The road was closed as there was not much holding it on and preparations made to remove it the following day. T4NSW provided a protective blanket on the pavement. Fortunately, Rik and Jarrod from SSS (specialist site services) were available with a compressor and some high-strength jacking pads.
While I thought it may have taken more than one lift to shift it, it went on the first attempt. We took a few more smaller ones off to tidy up.
Road was cleared and reopened later in the day. Thanks to T4 NSW and SSS!