This report presents a preliminary model for the evolution of the Langtang/Tsangbu rock avalanche and debris flow event. This intuitive model is intended to stimulate further analysis and discussion of this extraordinary and tragic event. Having spent some time looking over the disaster I thought I would condense my analysis. Our thoughts are with the 1000s of people affected.
The analysis below benefits from much public discussion of the event by other experts. In particular, I point to early analysis by Dan Shugar, Shawn Willsey and Philip Prince. Any errors below belong to me.
Initiating as a progressive creep failure throughout the first eight months of 2026 (or perhaps earlier), the mass experienced a catastrophic release on August 26, 2026. The model presented covers the first 22km of the event from source to the Border station at Rasuwagadhi. Over this distance the event transformed from a solid rock-ice slope collapse – (sturzstrom*, Pahiro) – into an ultra-fast, highly bulked, hyper-mobile debris flow. Five phases are defined (Figure 1).
(12/9/2026 *Sturzstrom – As Shawn Willsey points out use of this term in this analysis is not as it is generally applied. Sturzstroms are incredibly large rock avalanches with very long runs outs onto flatter ground. The Nepal rock failure was into a highly confined area, then downslope where the rock and ice debris mixed, the ice melted and the mass transitioned into debris flow. The word accurately paints the image of flying rock “Sturz” (fall, crash, or plunge) and “Strom” (stream, torrent, or river)! The Nepalese term for landslide is (Pahiro): Nepali word for a landslide, which often triggers rock-heavy floods in the Himalayas – perhaps this is a more appropriate term, or … “ठूलो पहिरो बगेर लेदो आएको” (Thulo pahiro bagerra ledo aaeko), which means “a massive landslide washed down and turned into a thick slurry flow.”)
(12/9/2026 – Geology-Google imagery from 2017/2026 provides a clear picture of the bedrock area. It appears to be an area of gneiss with intervening leucogranite sills. The bulk of the rock appears to be a banded gneiss, though. Layering across the front face has a sub-horizontal orientation. There are numerous defects visible – joints/faults/metamorphic foliations with various orientations – the bulk of the bedrock appears highly fractured. The brown colouring of the failure surface in drone images post event indicates considerable weathering, and weakening of rock along this plane, consistent with longer term development through water infiltration, freeze thaw cycles and erosion.)
(21/9/2026 -this analysis featured in a compelling podcast by Nepal Uncovered… https://longestway.com/a-technical-look-at-how-the-flood-happened-can-science-stop-nepals-next-flood/)

Figure 1. Google earth images showing location of landslide phases discussed in text. Phase 0 in source area. (12/9/2026 – image updated)
Phase 0: Pre-Failure Progressive Creep and Collapse
The disaster is inferred to have initiated early in 2026 (or earlier) through progressive structural degradation along a 45° discontinuous defect (joint or fault) in the bedrock gneiss, leading to total collapse on August 26, 2026. Several stages of collapse are expected following generalized models for large rock failures (eg https://doi.org/10.1139/t02-085).
The Frictional Steady-State (January – May): Instability initiated in or prior to January 2026. Google images covering the bedrock from January 7, 2026 show linear features along bedrock defects suggestive of tension cracks (Figure 2). These may be simply due to snow accumulation on linear bedrock features or snow depressions caused by movement on recently formed tension cracks. Further analysis is required to establish whether they are early indicators of movement. It is possible movement was initiated earlier.
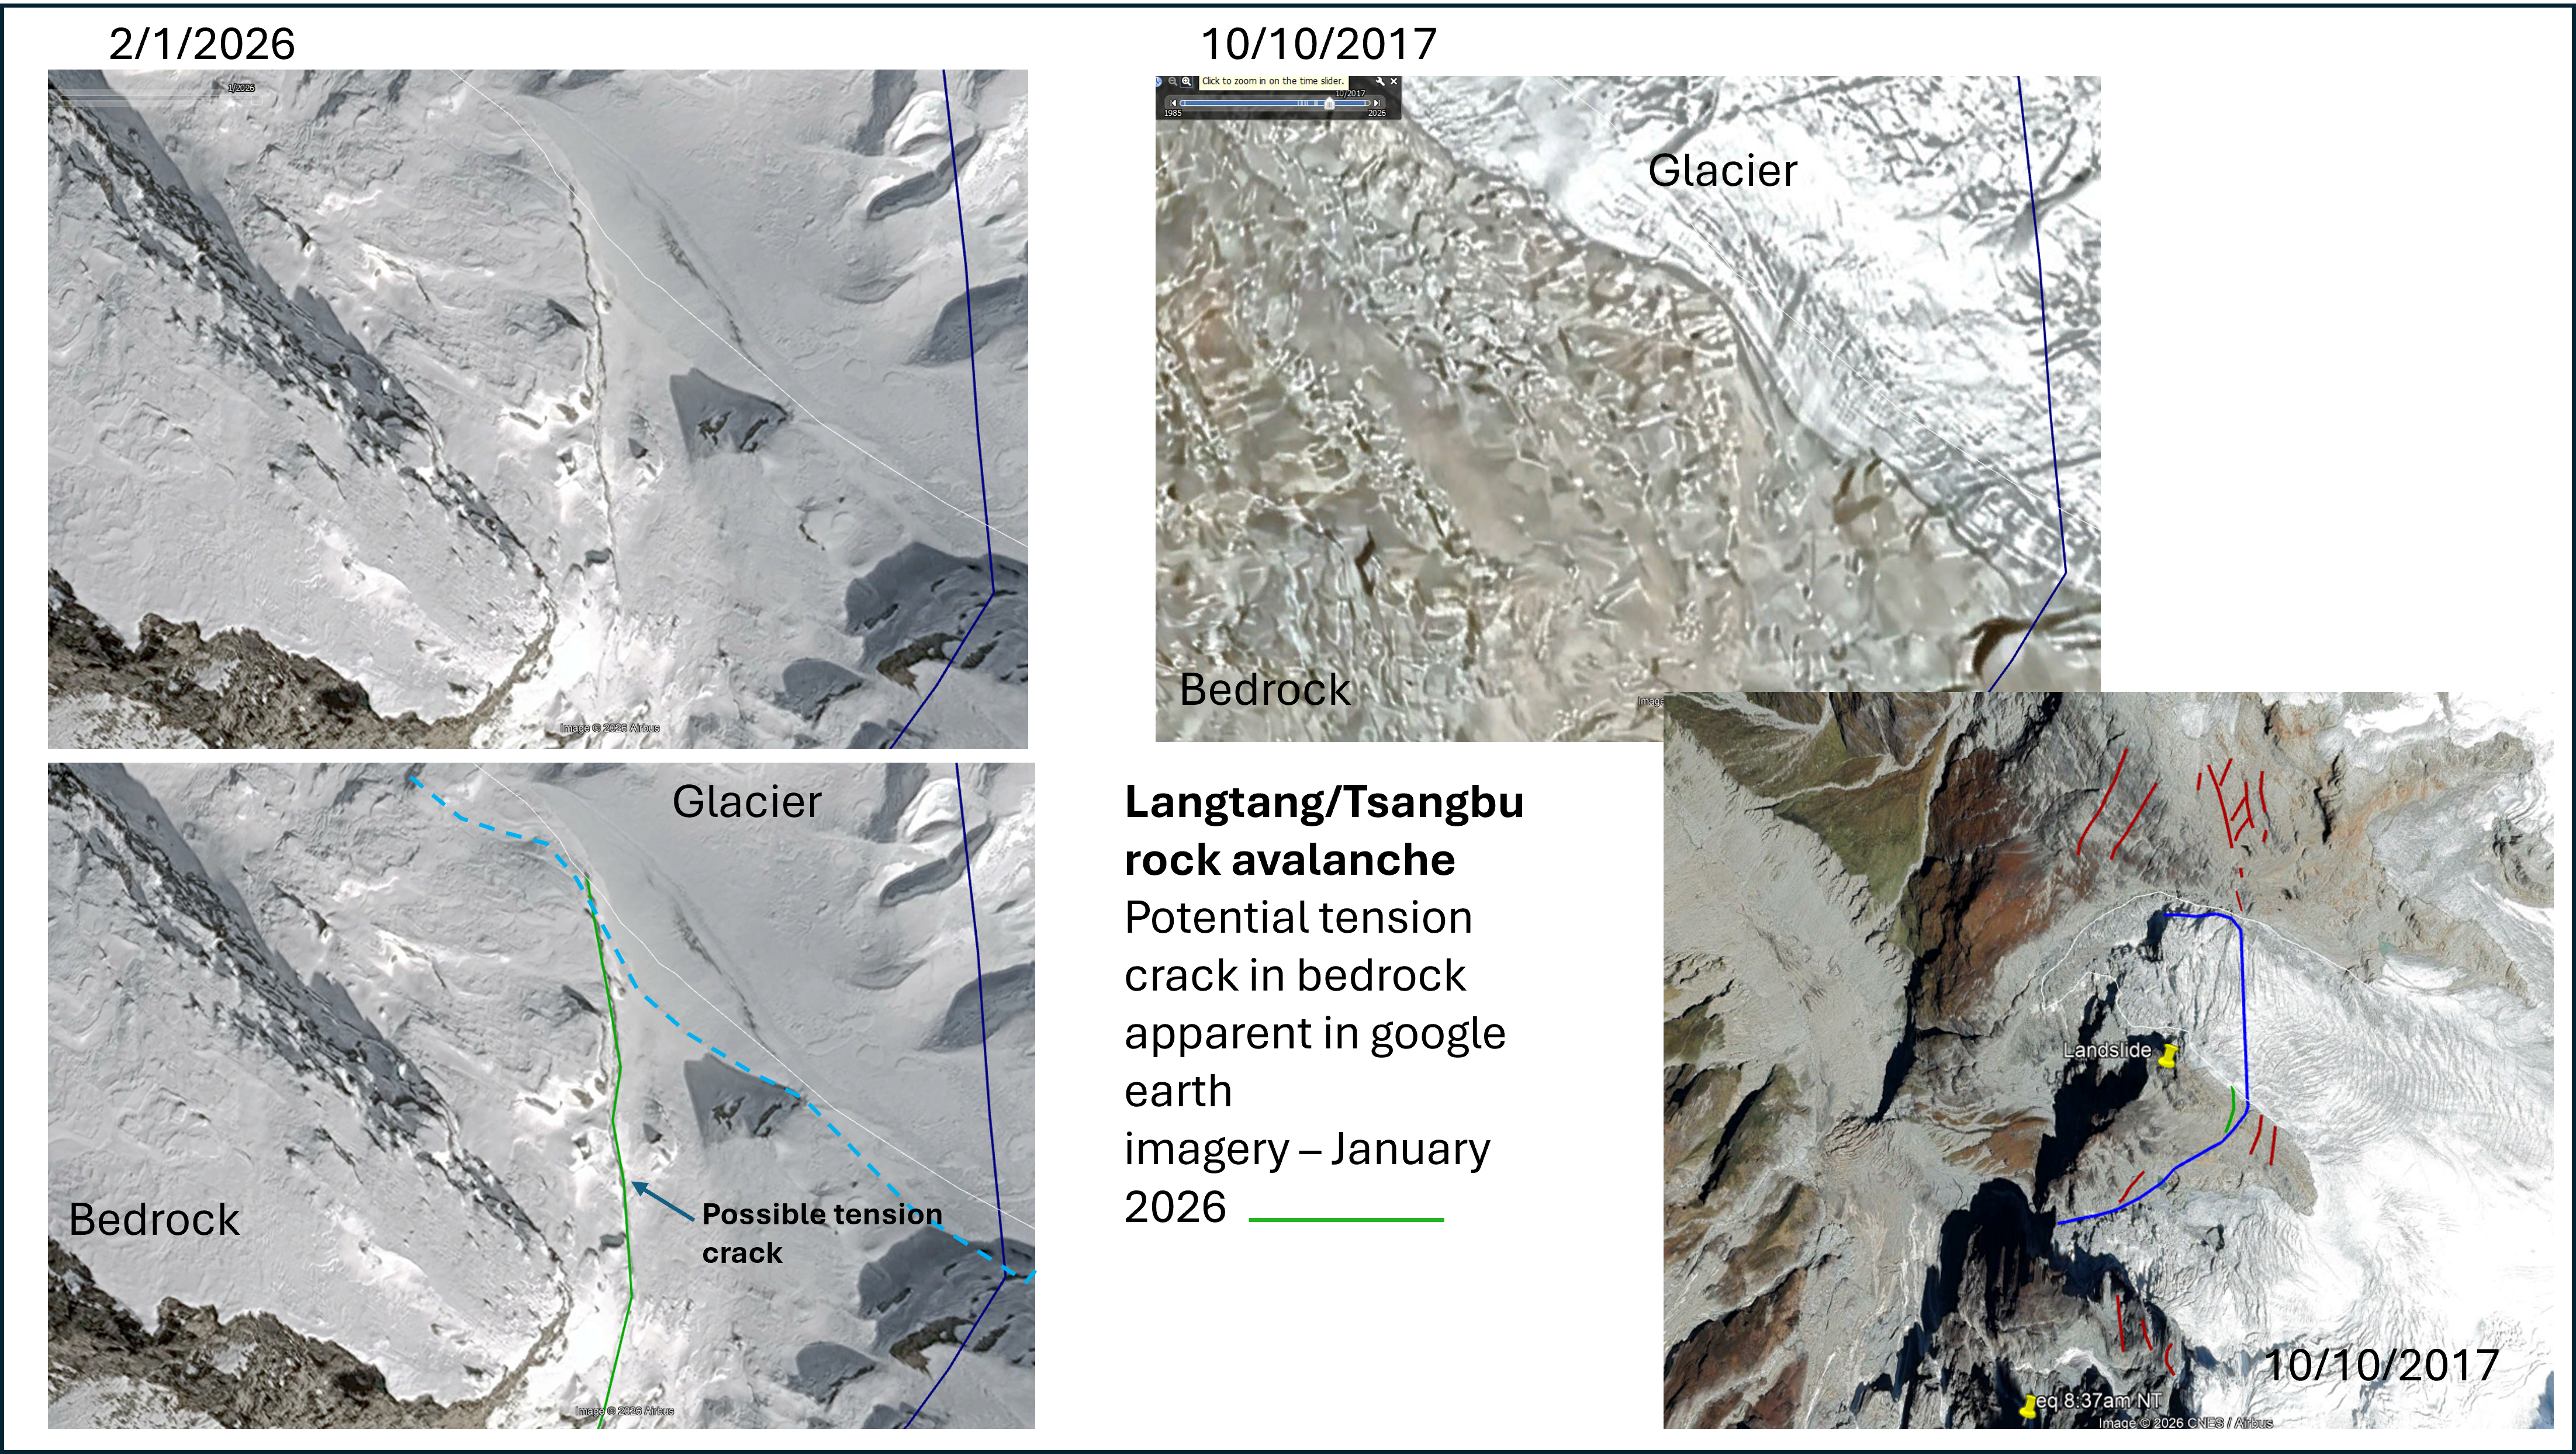
Figure 2. Google earth imagery 7/1/2026 and 10/10/2017. Linear features following bedrock defects are suggestive of presence of tension cracks.
Under a generalized model during this early Pre-Monsoon period, the rock mass remained in a secondary creep phase, perhaps moving at a stable rate of ~1.5 mm/day. Sub-surface ice within the bedrock joints acted as a structural binding agent, keeping the mass in a temporary state of equilibrium.
- The Onset of Acceleration (May 1 – June 1): As temperatures rose during the late Pre-Monsoon spring thaw, meltwater began infiltrating deep structural fissures, elevating internal pore-fluid pressures. The rock mass likely broke its linear displacement trend in early May. Intact rock bridges supporting the mass began failing in shear, driving creep velocity to ~4 mm/day by early June.
- The Monsoonal Hyper-Acceleration (June 1 – August 25): The arrival of the continuous monsoon on June 1 introduced an unbroken, multi-month window of precipitation. Water infiltration flooded now open tension cracks, driving pore pressures to critical levels and drastically reducing effective friction along the main 45° failure plane. Displacement likely accelerated over this period with indicative values in order of 10 mm/day by July 1 and 20 mm/day by earlyAugust. By late August, the slope transitioned into an uncontrollable asymptotic tertiary creep runaway, with displacement velocity accelerating exponentially to over 400 mm/day by August 25.
- Catastrophic Release: On August 26, 2026, the remaining structural rock bridges experienced total failure, instantly transitioning the static slope into a dynamic 132 million cubic metre sturzstrom*.
- A graphical representation of suggested movement phases is shown in Figure 3.
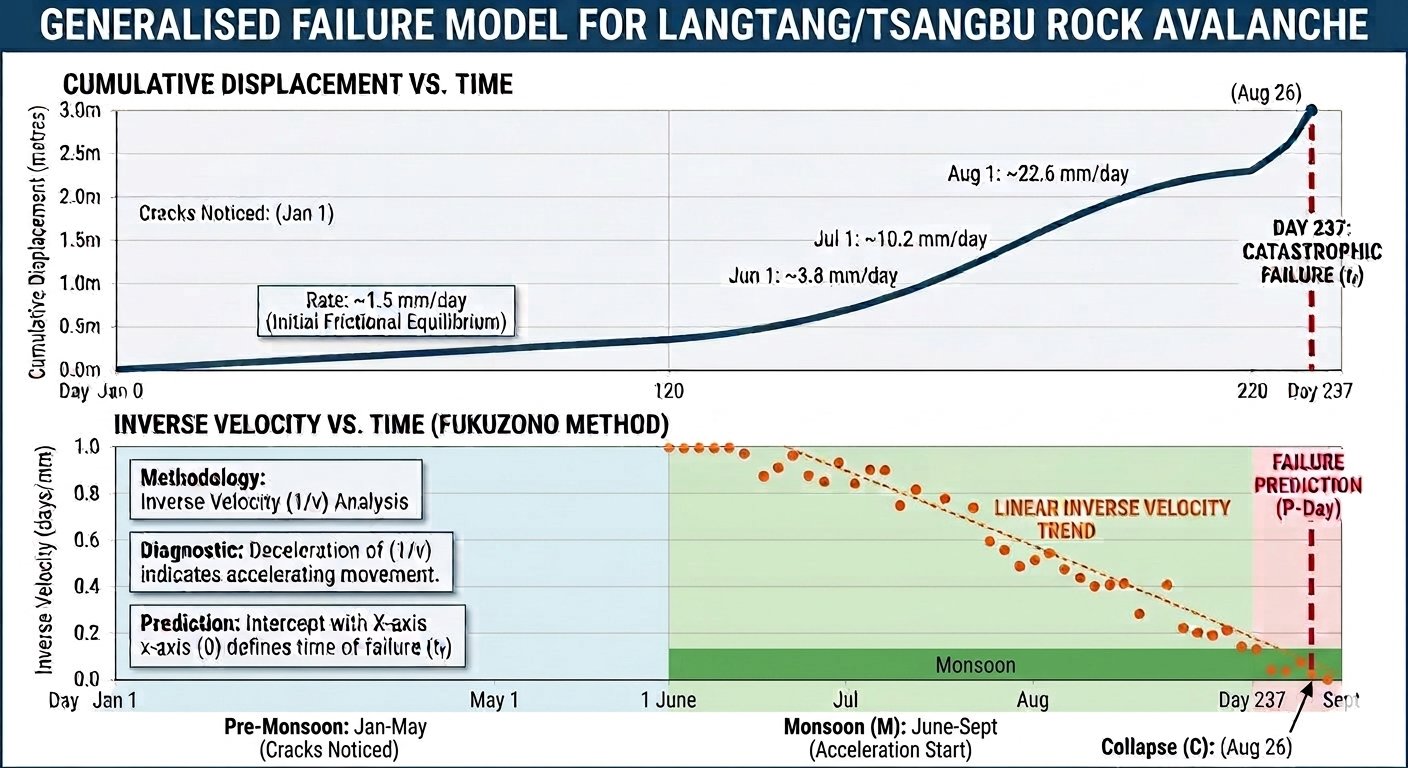
Figure 3 Generalised displacement – time model for large rock slope failure applied to Langtang/Tsangbu rock avalanche. Acceleration driven by monsoonal rains and increased summer temperatures. AI generated.
Phase 1: Catastrophic Collapse, Seismogenesis, & Rebound
The sudden release of the 132 million cubic metre mass—comprised of 87% gneiss rock and 13% ice by volume—plunged 1,200 vertical metres down the steep slope, releasing 3.84 × 10¹⁵ Joules (3.84 Petajoules) of gravitational potential energy (Figure 4 and 5). The failure has a general translational/ wedge style mechanic bound by structural defects. The area under the glacial – north side – appears to have failed at an earlier stage – perhaps also as a large rock slide, or incrementally in smaller sections. The area of rock appears to taper to the north, under the upper glacier. This phase takes a few seconds!
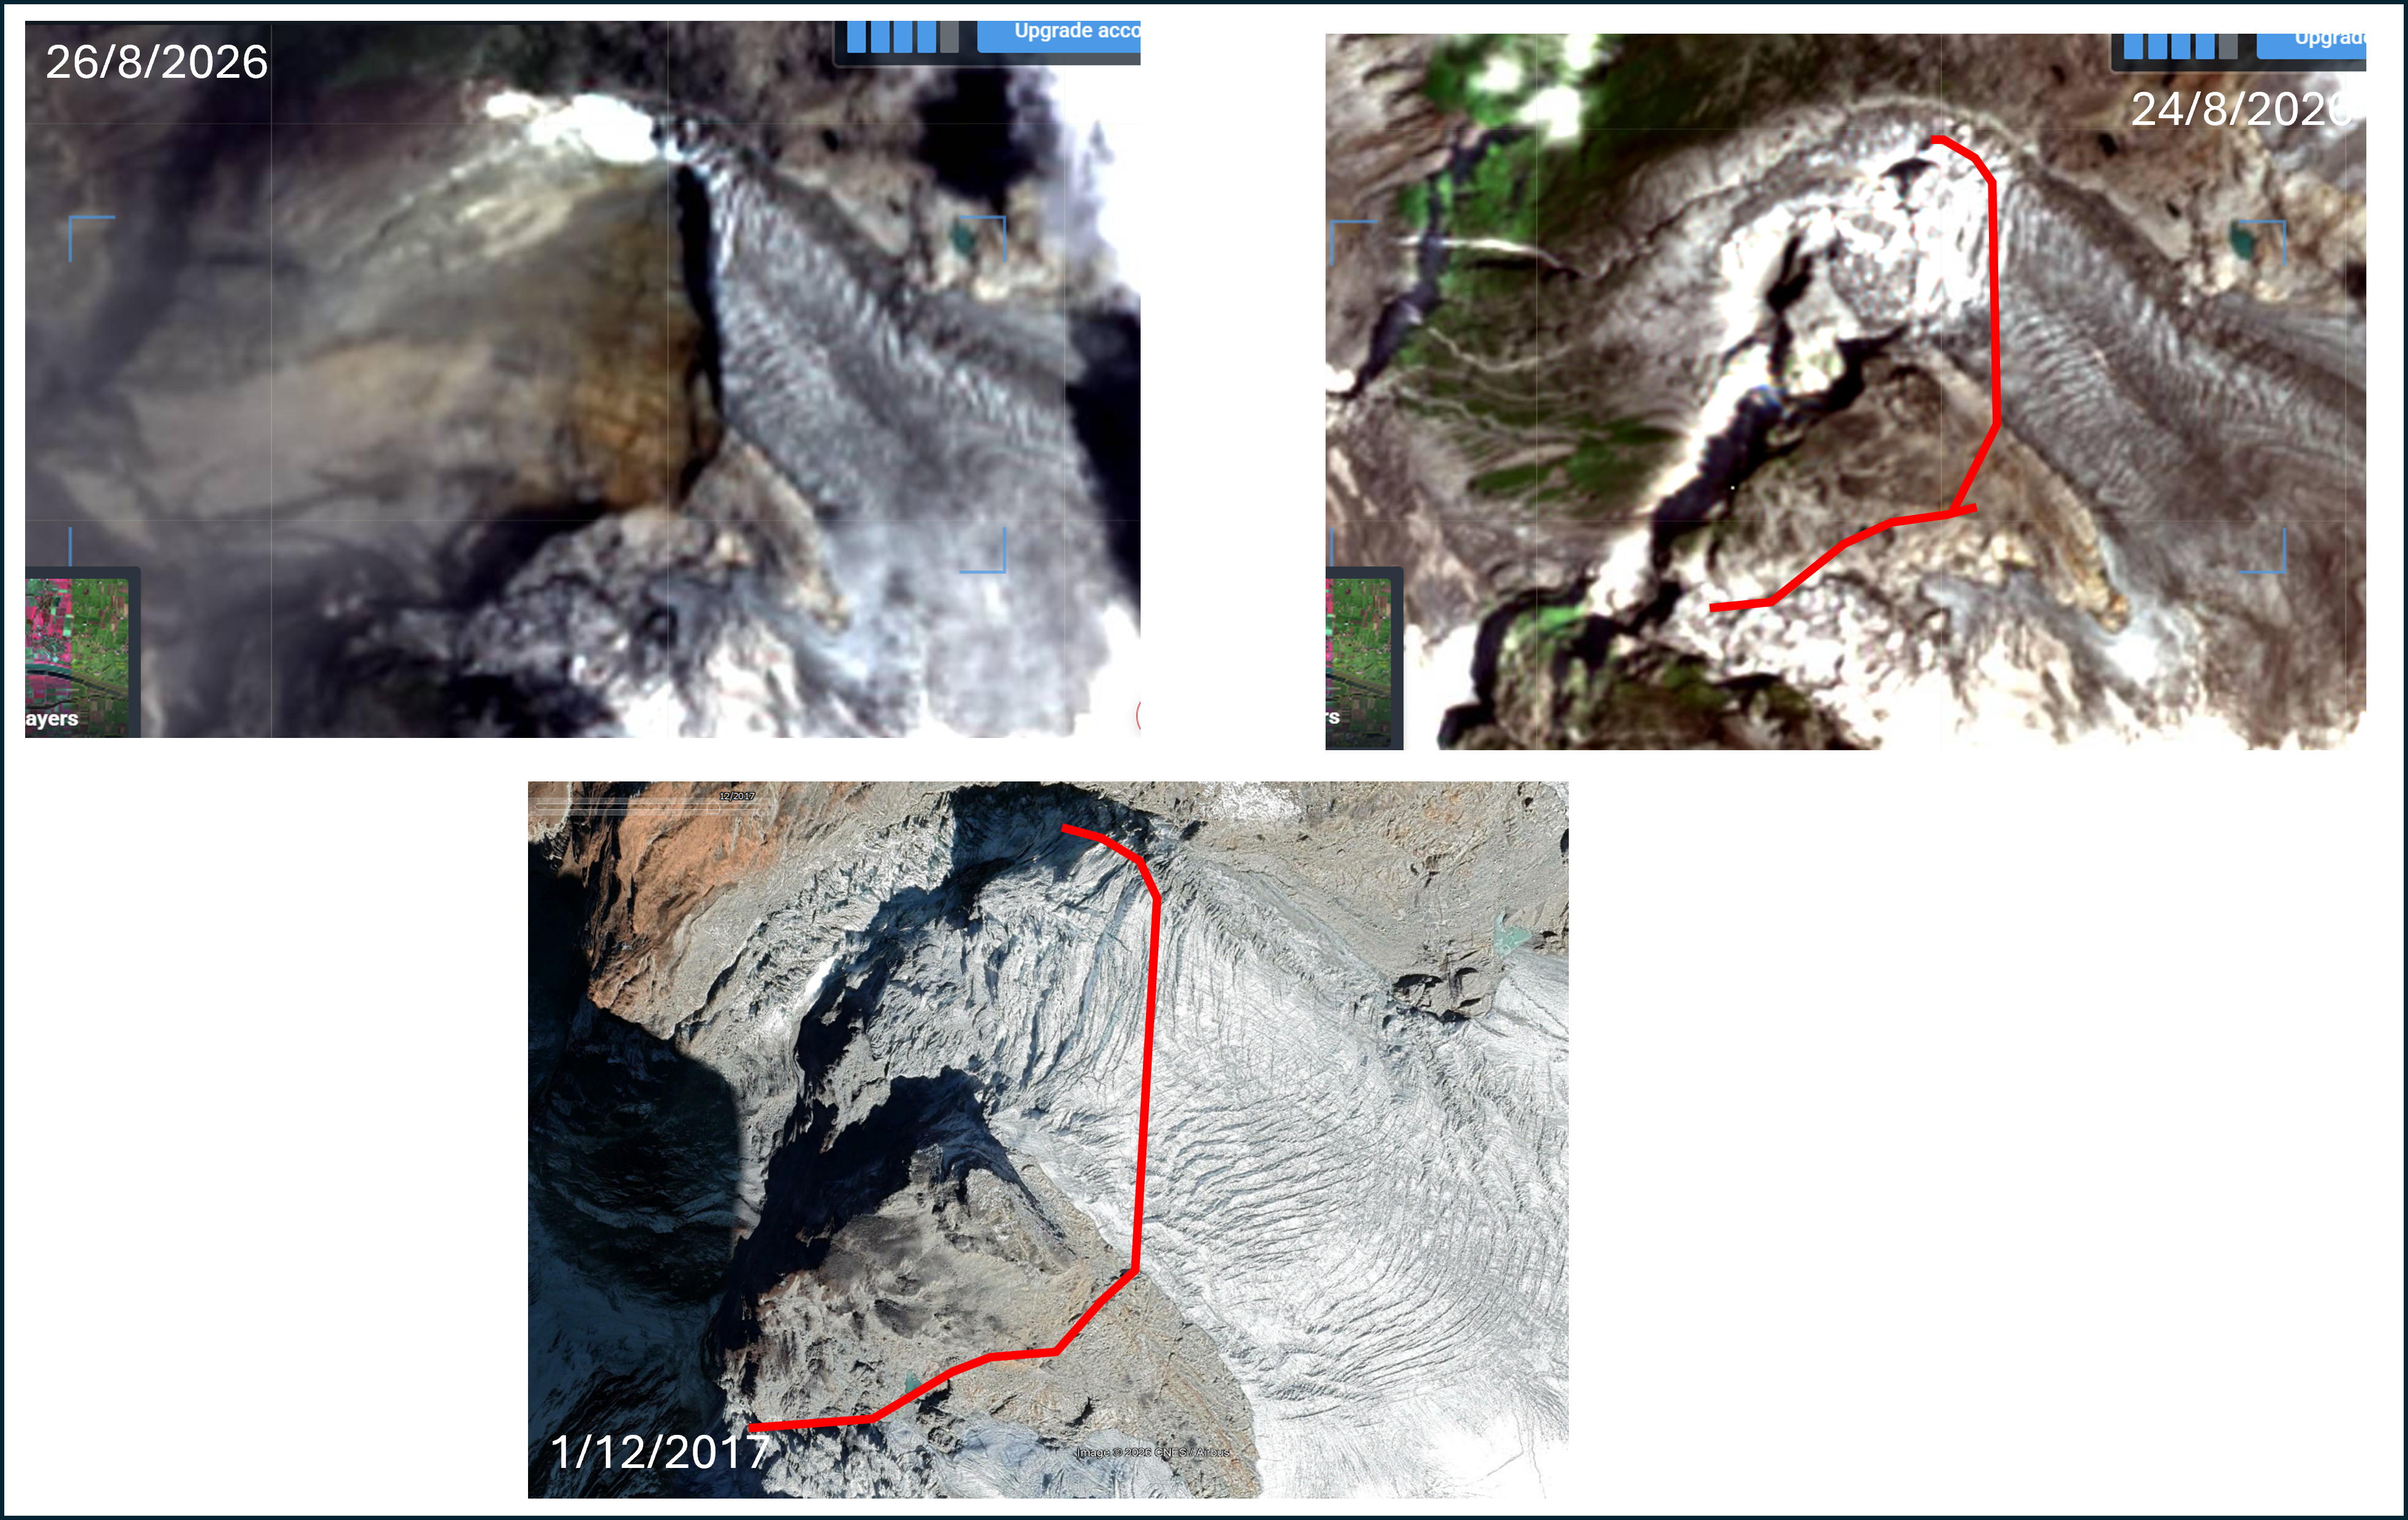
Figure 4. Satellite imagery pre and post event and google earth imagery – backscarp to failure indicated by red line.
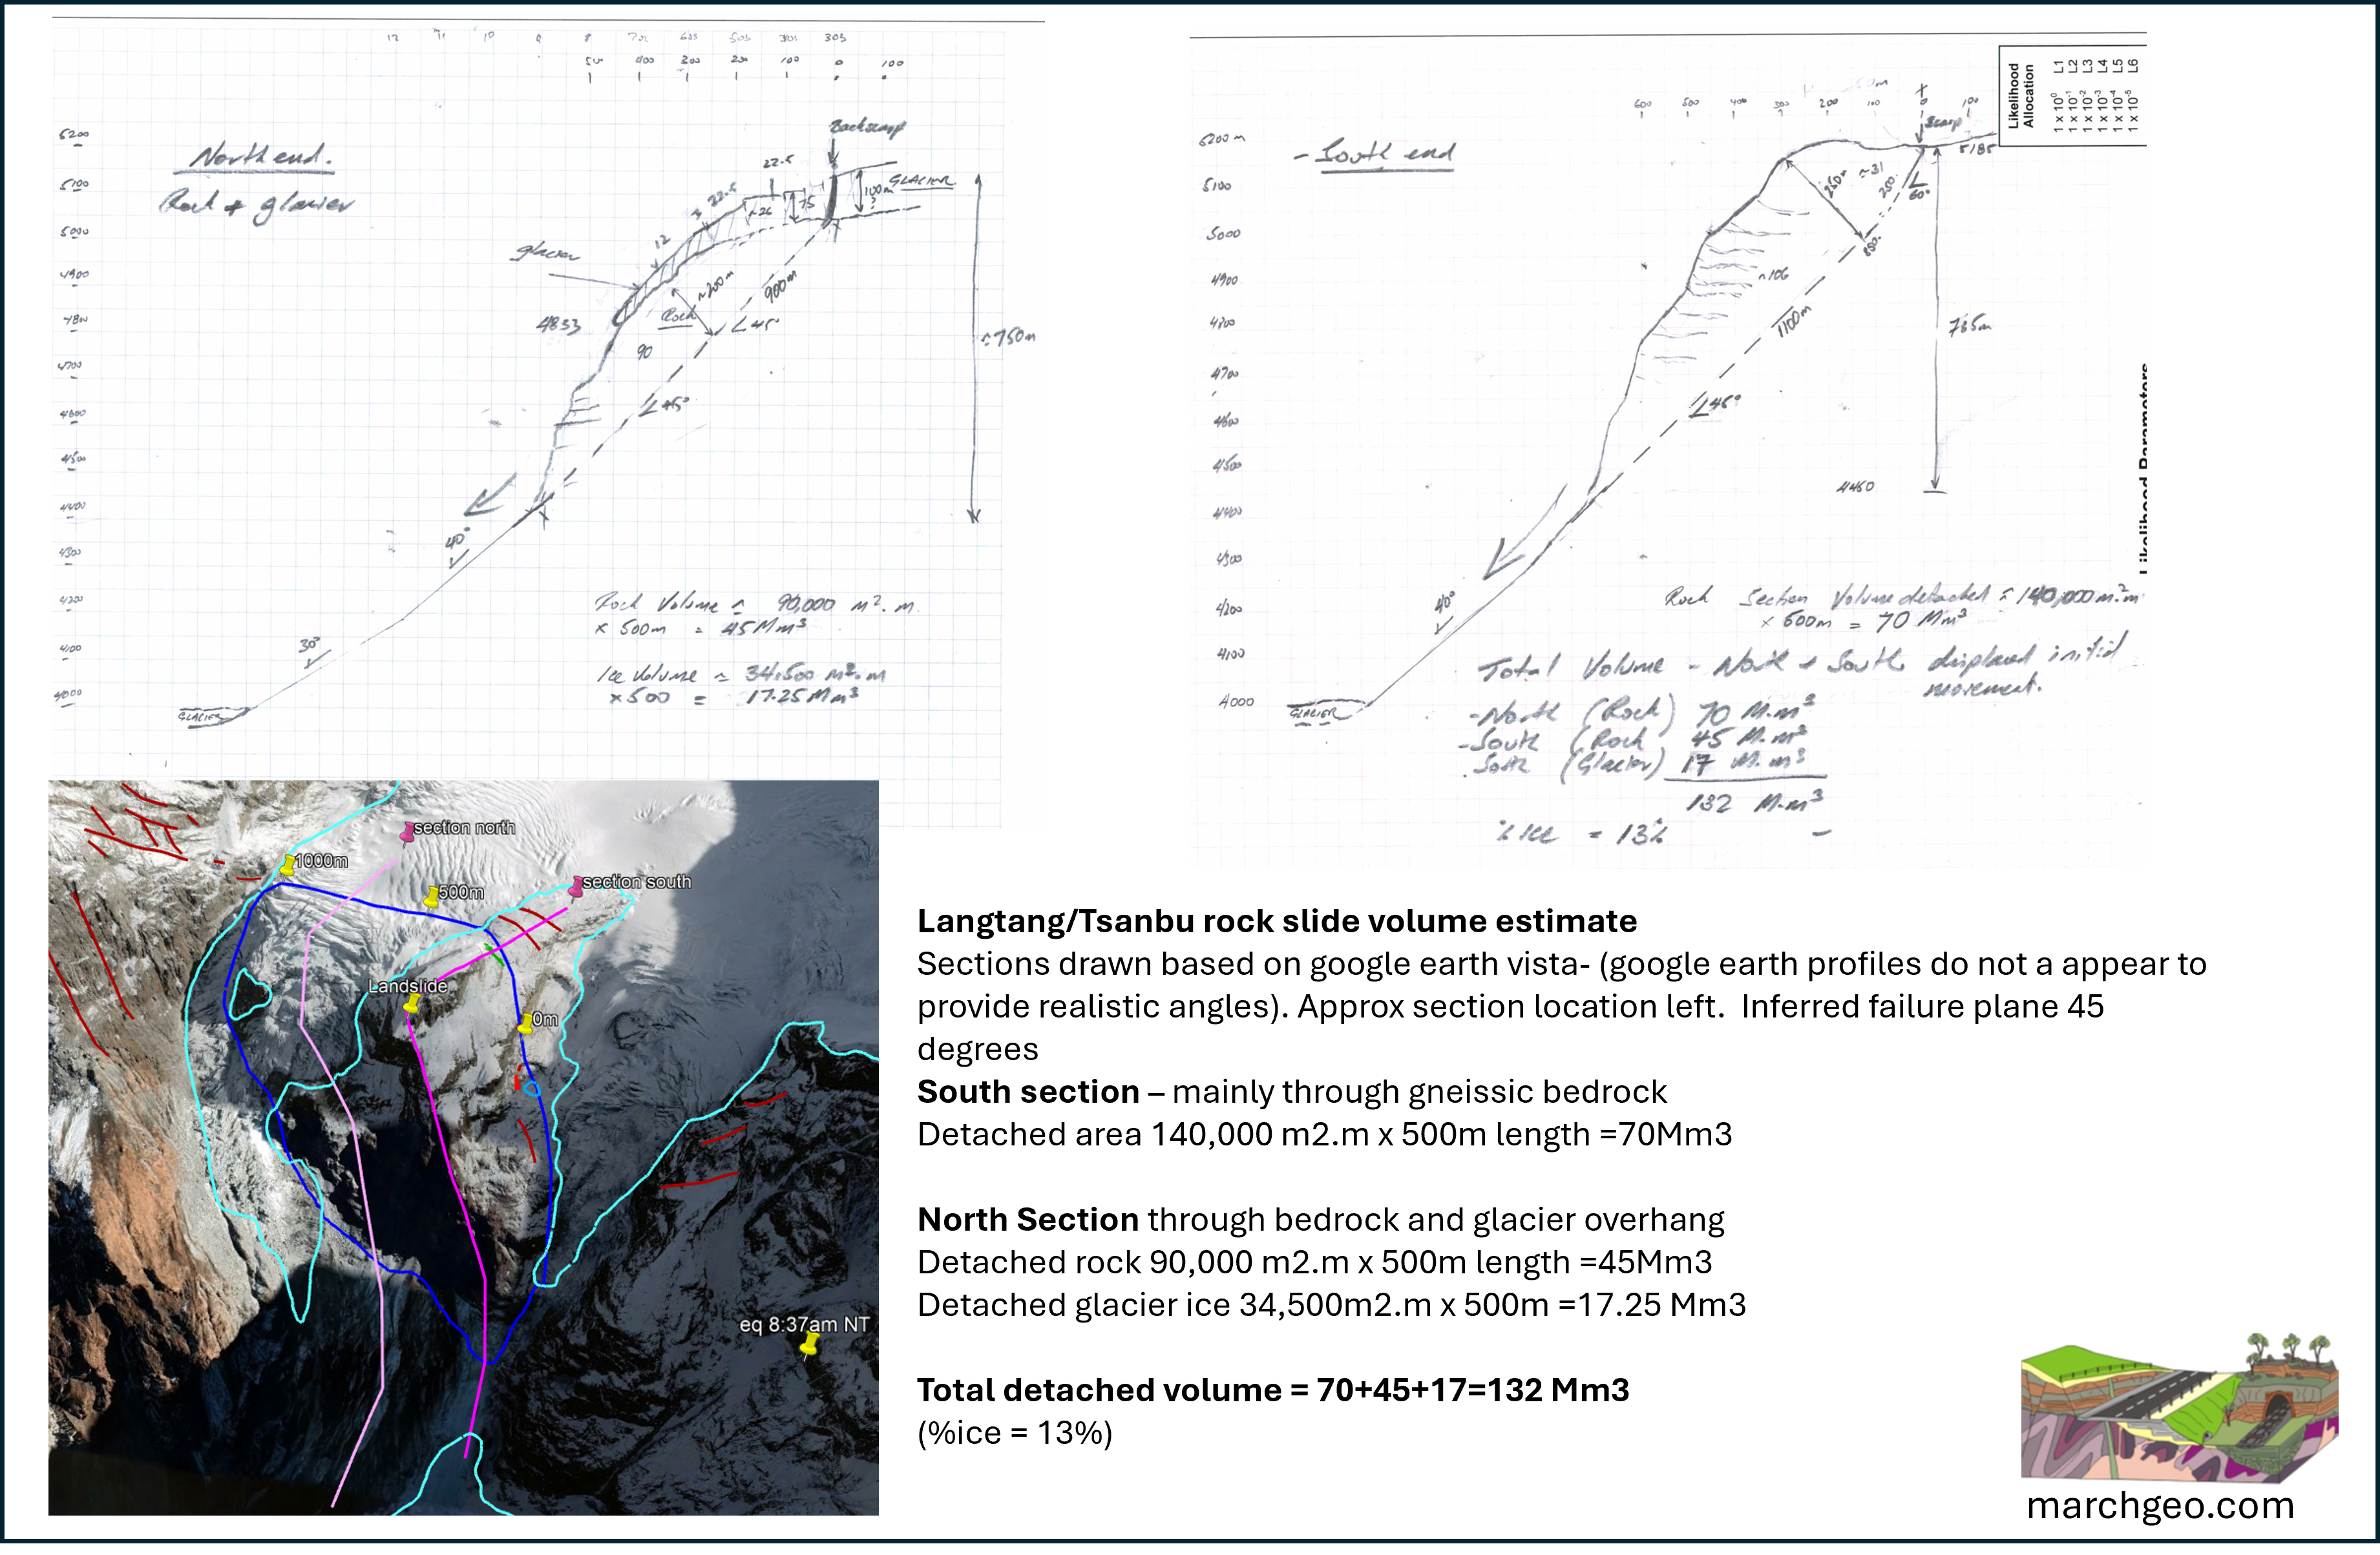
Figure 5 Cross sections and volume estimate for Langtang/Tsangbu rock avalanche – initial ice content put at about13%
- Impact Seismicity & Flash Melting: Upon striking the hard rock valley floor, the immense impact generated a magnitude 5.2 earthquake. Accounting for a seismic efficiency of 0.1% (3.98 × 10¹² J radiated as seismic waves), the remaining 99.9% of the total potential energy converted instantly into frictional heat and mechanical rock crushing. This thermal energy flash-melted 11.5 billion kilograms (73.2%) of the internal ice into liquid water.
- Opposite Slope Run-Up: Driven by severe forward momentum, the mass surged 500 metres up the opposite 45° valley wall and slid back down. This U-turn generated an additional 3.39 × 10¹⁴ to 6.78 × 10¹⁴ Joules of frictional work. The shearing action liquefied another 1.02 to 2.03 billion kilograms of ice. By the time the avalanche returned to the valley floor for the second time, 86% of its original ice assets had converted into liquid water.
Phase 2: Glacial Chute Entrainment & Acceleration
Rebounding off the opposite wall, the avalanche entered a 2-kilometre-long remnant glacier chute with an estimated average thickness of 15 metres with approximate slope of 25°.
- Mass Bulking: Assuming a representative flow path width of 500 metres, the massive shear forces at the base of the flow completely scoured and incorporated the glacier, entraining an additional 15 million cubic metres (1.38 × 10¹⁰ kg) of ice into the landslide matrix.
- Chute Acceleration: The vertical drop down this 25° glacial chute released an additional 2.76 × 10¹⁵ Joules of potential energy. Intense rock-on-rock grinding and fluid turbulence melted up to 8.26 billion kilograms of ice entrained by the lower glacier.
- Velocity Metrics: Highly lubricated by the basal melted ice slush, the flow rapidly accelerated to a terminal velocity ranging between 75 and 125 metres per second (270 to 450 km/h). At the exit of the 2 km chute, the total moving volume stood at 147 million cubic metres, with liquid water comprising 9.8% to 14.3% of the flow by volume.
Phase 3: Intermediate Valley Flattening & Complete Liquefaction
The flow exited the steep glacier chute and entered a 4-kilometre-long intermediate valley section characterized by a constrained width of 300 metres and a gentler 10% average slope.
- Deceleration Profile: The sharp drop in gradient and high boundary resistance of the 300-metre wide channel slow the flowing mass. The flow shed its excessive entry velocity, settling into a stable, slope-dictated terminal velocity of 25 to 40 metres per second (90 to 144 km/h).
- Phase Transition to Debris Flow: The continuous grinding down this 4 km stretch released enough frictional heat to flash-melt 100% of the remaining ice within the matrix. Total liquid water rose to 29.5 billion kilograms. This completed the mechanical transition of the disaster from a rock avalanche into a fluidised debris flow with a water content of 8.7% by mass and 20.4% by volume.
Phase 4: Confined River Canyon & Intense Soil Scouring
In this section, the debris flow entered the Lhende River and surged into a steeply confined valley for a distance of 14 kilometres on an average slope of about 12%. The flow hit the Lhende head on ramping up over 400m on the opposite slope before turning downstream.
- Hydro-Dynamic Interaction: Assuming the canyon contained an active river flowing at 20 m³/s. Over the brief duration of the surge event, the river contributed roughly 150,000 metric tonnes of water—a negligible addition to the existing 29.5 billion kilograms of water, resulting in no meaningful fluid dilution.
- Re-Acceleration: The narrow canyon walls prevented lateral spreading, causing the flow depth to swell to an estimated 25–35 metres. This severe vertical bulking reduced relative basal drag, allowing the flow to re-accelerate to a terminal speed of 30 to 45 metres per second (110 to 160 km/h) as it passed the border station.
- Debris Erosion & Final Fluid Composition: The high shear stress of the deep flow aggressively scoured the canyon floor, entraining an estimated 2,000 cubic metres of soil and rock debris for every metre travelled. This process added 28 million cubic metres (75.6 × 10⁹ kg) of material to the avalanche. Accounting for a 5% ambient water content by mass within the scoured valley soil, an additional 3.78 billion kilograms of liquid water was injected into the flow alongside the dry solids.
Summary of System State at Rasuwanadhi Border crossing point
| Parameter | Metric Value | Analysis & Physical Significance |
| Total Moving Volume | 175 million m³ | A 32.5% increase from the initial collapse volume via intense glacier and valley floor erosion. |
| Total System Mass | 4.16 × 10¹¹ kg | 416 million metric tonnes of moving rock, scoured soil, and fluid. |
| Total Liquid Water Mass | 33.43 × 10⁹ kg | Derived from the complete melting of all initial and entrained ice, river volume, and soil moisture. |
| Exit Terminal Velocity | 30 to 45 m/s (110–160 km/h) | High-velocity fluid motion capable of total structural destruction upon impact. |
| Final Water Fraction (Mass) | 8.0% | The mass proportion of liquid phase to solid phase across the bulk slurry. |
| Final Water Fraction (Volume) | 18.7% | Nearly one-fifth of the total volume exists as a liquid matrix, maintaining fluidization. |
Discussion
Timing: The earthquake resulting from the landslide was felt at 8:37am Nepal local time. CCTV at the China/Nepal border crossing (destroyed by the debris flow) has a time stamp of 10:59:49 (China Standard Time) = 8:44 am Nepal local time as the flow arrives. This leaves no window for a dam to form – the flow was continuous for the full length. Incredibly, the struzstrom*/debris flow covered the approx. 21.2km down the Lhende River from the landslide source in just 7-8 minutes! Average velocity of the flow for this section, from source to border station, then is estimated to be about 160 km/h – 180km/h.
Water volume: The model presented above accounts somewhat for potential water sources and required volume to sustain a debris flow. The initial estimate of ice volume of the upper glacier does not appear sufficient to sustain a debris flow on its own, and without addition of water from the lower glacier it is conceivable that the event could have remained dominantly a “dry” rock avalanche and been stopped in the upper reaches of the Lhende River creating a massive landslide dam.
Runout for very large volume, dry landslides is proportional to the square root of the starting volume. Based on a detached volume of 132Mm3 the runout would be expected to be about 11km on a flat surface. If it did not turn into a debris flow and remained mainly a rock avalanche this dam would have been huge and would have threatened development downstream – there would have been more warning time.
With the addition of water from melting of the lower glacier total water volume available shifts to the 20% range and a debris flow can be sustained. It is interesting to note that water in the river did not add that much to the overall water content.
More detailed analysis is required to more accurately assess the rock and ice volume involved in the event.
Transition from Rock/ice avalanche to debris flow: There appears to be sufficient kinetic energy in the system to provide for complete melting of any entrained ice prior to the flow reaching the Lhende River. The transition from rock – ice avalanche to debris flow likely occurred in the valley below the lower glacier.
Comparison to other large landslides: The Chamoli Landslide (https://science.sciencemag.org/content/early/2021/06/09/science.abh4455) in India in Feb 2021 shares many features with the Langtang/Tsangbu rock avalanche and debris flow event. Chamoli was 27Mm3 in volume (~5x less than Nepal based on estimates above) with a debris flow run out of over 17km. Chamoli had a starting rock/ice ratio with 20% ice and kinetic energy turned this to water in the initial fall perhaps providing for more rapid transiton to a debris flow. Both highly destructive events. There were also indications of precursor movement at Chamoli.
Any warning?: Large rock falls of this nature do not generally occur without precursor movements. It appears that if movement had been detected much earlier in 2026, the area could have been monitored in more detail, similar to events preceding the Blatten Landslide in Switzerland in May, 2025. Follow-up on potential cracks suggested in Imagery from early January is required to determine when movement initiated.
In my view it would have been incredibly difficult to accurately predict the behaviour of the Langtang/Tsangbu rock avalanche event. Early warnings allowing people to get out to higher ground would have been substantially reduced the toll. There were some seismic signals detected prior to 5.2M seismic event that marked the collapse. Recognition of these (given they are connected to the event) may have provided more warning time downstream. It appears that a wider network of seismic stations in the region may assist in earlier recognition of these events. There is a risk of false positives that could have a huge disruptive effect. This requires much more detailed investigation.
The Himalayas are vast and monitoring rock slopes represents an immense challenge. Remote monitoring of rock slopes via InSAR or other satellite technology to catch events like this is feasible but would require substantial resources to setup. For the Himalayas a cooperative centre for “mountain movement” could be established with resources from China, India, Pakistan and Nepal and other partners. The process of systematic comparisons between datasets to detect slope movement is perhaps something an AI could be trained to do, to speed up the process – flagging issues for more detailed expert analysis and potential follow-up. Or local higher-risk areas could be flagged for detailed satellite monitoring to reduce the scale of the task. This would also help identify other hazards (eg GLOF). This requires substantial further investigation but would certainly help reduce the human toll of such events.
Future development in the high Himalayas needs to take these events into account. There is already too much infrastructure exposed.
This event represents an immense human tragedy. We need to learn from it to reduce the impact of future events like this.


Tracking the progressive opening of that scarp from January 2026 through to collapse is the most valuable thing: predictive work and a real step beyond just describing what already happened.
On the energy budget, I also appreciate that this goes beyond the usual hand-waving of “friction melted the ice” as most coverage does. But walking through it in the order things actually happened exposes a problem. The initial 1200m fall: 99.9% of the 3.84 PJ goes to melt, 0.1% (~4×10¹² J) radiates away as the M5.2-equivalent seismic signal. That’s 100% of the budget already allocated — melt plus seismic — with nothing held back as kinetic energy. Then the flow continues down the 2km chute into the first river (Chusumdo Tsangpo): that segment’s own newly-released energy (2.76 PJ) also goes entirely into melting the entrained lower-glacier ice. So both segments independently spend everything they generate.
One clarification on the run-up onto the opposite wall — which the model places within the first segment. The flow reaches the valley floor at the Chusumdo Tsangpo River before the run-up happens — the 500m climb is on the far bank. Going up costs nothing new; it’s existing kinetic energy converting into potential energy. Coming back down just reverses that same conversion — PE back to KE. Since the round trip returns to roughly the same elevation, it injects no new gravitational energy into the budget at all: it’s KE→PE→KE, recycling energy already spent, not releasing a second 500m of fresh PE. So crediting that fall back down as additional melt double-counts it on two separate grounds: Phase 1’s own accounting (99.9% melt, 0.1% seismic) already leaves nothing to fund the climb in the first place (so by the model’s own numbers, the mass should have simply come to “rest” at the valley floor instead of climbing 😃), and even setting that aside, a closed KE-PE-KE loop can’t produce new energy regardless.
Reaching the river takes about 2150m of drop, and — once that double-counted run-up contribution is set aside — the energy budget supports roughly 14-15% water by volume there. That’s close to what the model’s own Phase 2 range already gives (9.8-14.3%): strip out the one erroneous addition, and the model lands roughly right by that point. On the other hand, that’s meaningfully short of the ~20-50% typically cited for water-debris flows — so worth asking directly: is 15% actually enough to sustain a flow like this, or does something else need to keep it flowing?
The claimed 29.5 billion kg / 8.7% mass / 20.4% volume — the model’s next milestone after the third segment at Lhende Khola confluence — has the same problem. It isn’t reachable on the actual budget: strip out the double-counted run-up and reserve enough energy to sustain the stated exit velocity, and what’s left supports more like 25 billion kg — about 7.4% mass / 17.7% volume. Call it a 15% energy shortfall. If it was already flowing once it reached the river, it’ll keep going, and more of the ice could have melted over the remaining ~1050 m to the border, so the final number at the crossing could end up even higher than either of these.
But that’s exactly the open question: is 14-15% water actually enough for this mixture to be flowing at all by the time it reaches the Chusumdo Tsangpo River? If not, something has to explain the motion at that point. And any additional liquid water could only have been already sitting in or under the glacier.
By: Michal Gust on September 11, 2026
at 12:27 AM
Thanks for commenting,much appreciated. there are some issues with matters raised.
The 99.9% conversion figure is the total cumulative thermal dissipation resulting from work done over the entire duration of Phase 1. Potential energy continuously transforms into kinetic energy during the fall, and it is the friction of the moving mass that generates the heat. The kinetic energy is the medium of transmission; it is not a third isolated bucket of energy that gets starved out.
You contend that moving up and down the far bank is a closed, self-cancelling loop (KE → PE → KE) that injects no new gravitational energy and that double-counts melt.
However a massive rock avalanche is not a conservative frictionless system. As the 132 million cubic metre mass slams into and slides up the opposite 45° wall, it experiences immense basal friction and internal shearing. Moving up costs kinetic energy, but falling back down releases new gravitational potential energy. Because friction acts continuously during both paths, the descent down the far wall generates massive new frictional work (3.39 × 10¹⁴ to 6.78 × 10¹⁴ Joules) that directly melts an additional 1 to 2 billion kilograms of ice. There is no double-counting.
The water volume appears at the lower limit for sustaining a debris flow. The overall water/debris content is very similar to the Chamoli event that had a starting 80:20 rock/ice ratio. I think this points to further work being required to understand flow dynamics of these very large rock/ice avalanches. I put a fairly conservative estimate on the ice volume in the lower glacier area- this may be incorrect, and it is possible more ice was in this area than my model allowed for.
Large-scale rock-ice avalanches are dynamic open systems, not rigid bodies moving through space. The mass fluctuates constantly due to co-seismic crushing, multi-stage glacier entrainment, and localized deposition. Furthermore, downstream energy budgets are heavily influenced by the transfer of momentum to entrained ambient-temperature materials and ambient thermal inputs.
Note the total available Ep is for the whole system. This is from source at 5200m to the area of deposition – estimated to be starting from about 700m where the grade drops substantially and the valley broadens.
Thanks for your input.
By: Marc Hendrickx on September 11, 2026
at 10:01 AM
Reaction (revised):
Thanks for the detailed reply. A few things worth separating out.
Good to see agreement that the water volume “appears at the lower limit for sustaining a debris flow” — that’s really the crux of what’s at issue here.
On the 99.9% figure: agreed, it’s a running total over Phase 1’s full duration, not something that happens at the instant of impact — I didn’t mean to suggest otherwise. But the same accounting applies to Phase 2 — in your own numbers, essentially all of Phase 2’s newly-released PE also goes to melt. So by the time the mass reaches the valley floor, after both phases, cumulatively 0.1% of Phase 1 PE has radiated away as the seismic signal and effectively 100% of the remaining PE from both phases has converted to heat/thermal energy — nothing reserved as kinetic energy at either stage. Yet the mass is demonstrably still moving fast enough at that point to climb 500m up the opposite wall. That’s the actual gap: not when the conversion happens, but that neither phase, on its own numbers, left anything over for continued motion.
On “falling back down releases new gravitational potential energy, no double-counting”: our earlier shorthand for this — calling it a closed loop — wasn’t quite right, and you’re correct that friction operates continuously on both legs, not just at the endpoints. But that refinement doesn’t change the physics. Climbing 500m converts existing kinetic energy into potential energy (plus whatever friction burns off getting there); coming back down only ever recovers that same 500m of potential energy, not new energy from outside the system (law of energy conservation applies here as well). Net elevation change over the round trip is zero, so its net gravitational contribution is zero too — friction on the way down is still spending energy the system already had.
It doesn’t actually matter which specific phase the kinetic energy turns into thermal energy — for the final result, all that matters is how much kinetic energy is left at the very end. So the velocities below are best read as illustrative rather than a claim about exactly how the mass moved (they’re not unconstrained — bounded by how much PE is available and what the run-up needs to physically happen — but within that, the total isn’t sensitive to which exact values you pick).
Segment,Drop height,PE released,Velocity,KE,TE,Melted ice
1. Initial fall,1250 m (Σ 1250 m),3.99 PJ (Σ 3.99 PJ),450 km/h,2.55 PJ,1.45 PJ (Σ 1.45 PJ),4.3 bn kg (Σ 4.3 bn kg)
2. Chute,900 m (Σ 2150 m),2.87 PJ (Σ 6.86 PJ),450 km/h,2.55 PJ,2.87 PJ (Σ 4.32 PJ),8.6 bn kg (Σ 12.9 bn kg)
3. Run-up (climbing),−500 m (Σ 1650 m),−1.60 PJ (Σ 5.27 PJ),0 km/h,0 PJ,0.95 PJ (Σ 5.27 PJ),2.8 bn kg (Σ 15.8 bn kg)
4. Return (descending),500 m (Σ 2150 m),1.60 PJ (Σ 6.86 PJ),240 km/h,0.72 PJ,0.87 PJ (Σ 6.14 PJ),2.6 bn kg (Σ 18.4 bn kg)
5. River valley,530 m (Σ 2680 m),1.69 PJ (Σ 8.56 PJ),135 km/h,0.23 PJ,2.19 PJ (Σ 8.33 PJ),6.5 bn kg (Σ 24.9 bn kg)
Total: 2680 m net drop, 8.56 PJ released, 8.33 PJ of that as heat, ~24.9 billion kg melted (7.3% by mass, 17.6% by volume) — final velocity 135 km/h.
That’s against the 29.5 billion kg / 8.7% / 20.4% claimed at this point — about 84.5% of it, a 15.5% shortfall.
To be precise about when the flow actually needs enough water to move: by the start of segment 5 (Phase 3 in the model), the flow is already in a normal, low-gradient valley with no more ice in the substrate, so whatever water content it has at that point is what needs to explain its mobility further down the valley. Even under the most generous reading (crediting the full 2150m of PE released so far, as if velocity had dropped close to zero right before this segment and the flow re-accelerated purely on segment 5’s own energy), that caps out around 14.8% by volume.
I think we can actually agree on your own closing line: “further work is required to understand flow dynamics of these very large rock/ice avalanches.” That’s really the question I was raising too.
By: Michal Gust on September 12, 2026
at 8:34 PM
Thank you for this analysis. The discussion on ice melting could be improved by more clearly defining the potential energy budget divided among kinetic energy, heating, melting, seismic waves, and fragmentation. When the landslide mass reaches the bottom of the valley the gravitational PE is reduced to zero and all of the energy budget must be allocated to the buckets listed above.
Although you mention soil moisture in the summary table, you have underestimated its significance to the overall water available to the debris flow. Assuming 25% porosity of the saturated rock mass, the pore water volume could be two to ten times larger than melted ice, depending on the amount of ice melting. If silty soil is included in the landslide mass (typical of glacially derived rock flour) the porosity could be as much as 50%. The combined pore water would provide enough water to sustain the debris flow.
Similarly, the total water available in the river valley is much greater than the liquid water above the surface. All of the alluvium in the river valley, with porosities of 25 to 50% and likely saturated, is available for entrainment into the debris flow and could be many multiples of the surface water volume.
By: Robert A McManus, P.E. on September 12, 2026
at 7:32 AM
Thanks for commenting. The energy budget only considers a small window. The total available Ep is for the whole system. This is from source at 5200m to the area of deposition – estimated to be starting from about 700m where the grade drops substantially and the valley broadens. Large-scale rock-ice avalanches are dynamic open systems, not rigid bodies moving through space. The mass fluctuates constantly due to co-seismic crushing, multi-stage glacier entrainment, and localized deposition.
Agree there is likely more water available in the river system than indicated from the sources you mention. I grabbed some ballpark figures on the lower end to see what would come out. I’ll have another go at using a wider range of figures and see the result. There will also be a point where suspended material starts to drop and the water proportion is increased through this process, accounting for greater water content downstream.
By: Marc Hendrickx on September 12, 2026
at 8:07 AM
[…] Nepal – Langtang/Tsangbu rock avalanche event: rock avalanche & debris flow model by Marc Hen… […]
By: A Technical Look At How The Flood Happened: Can Science Stop Nepal’s Next Flood? - Nepal Uncovered Travel Podcast on September 19, 2026
at 11:22 AM